
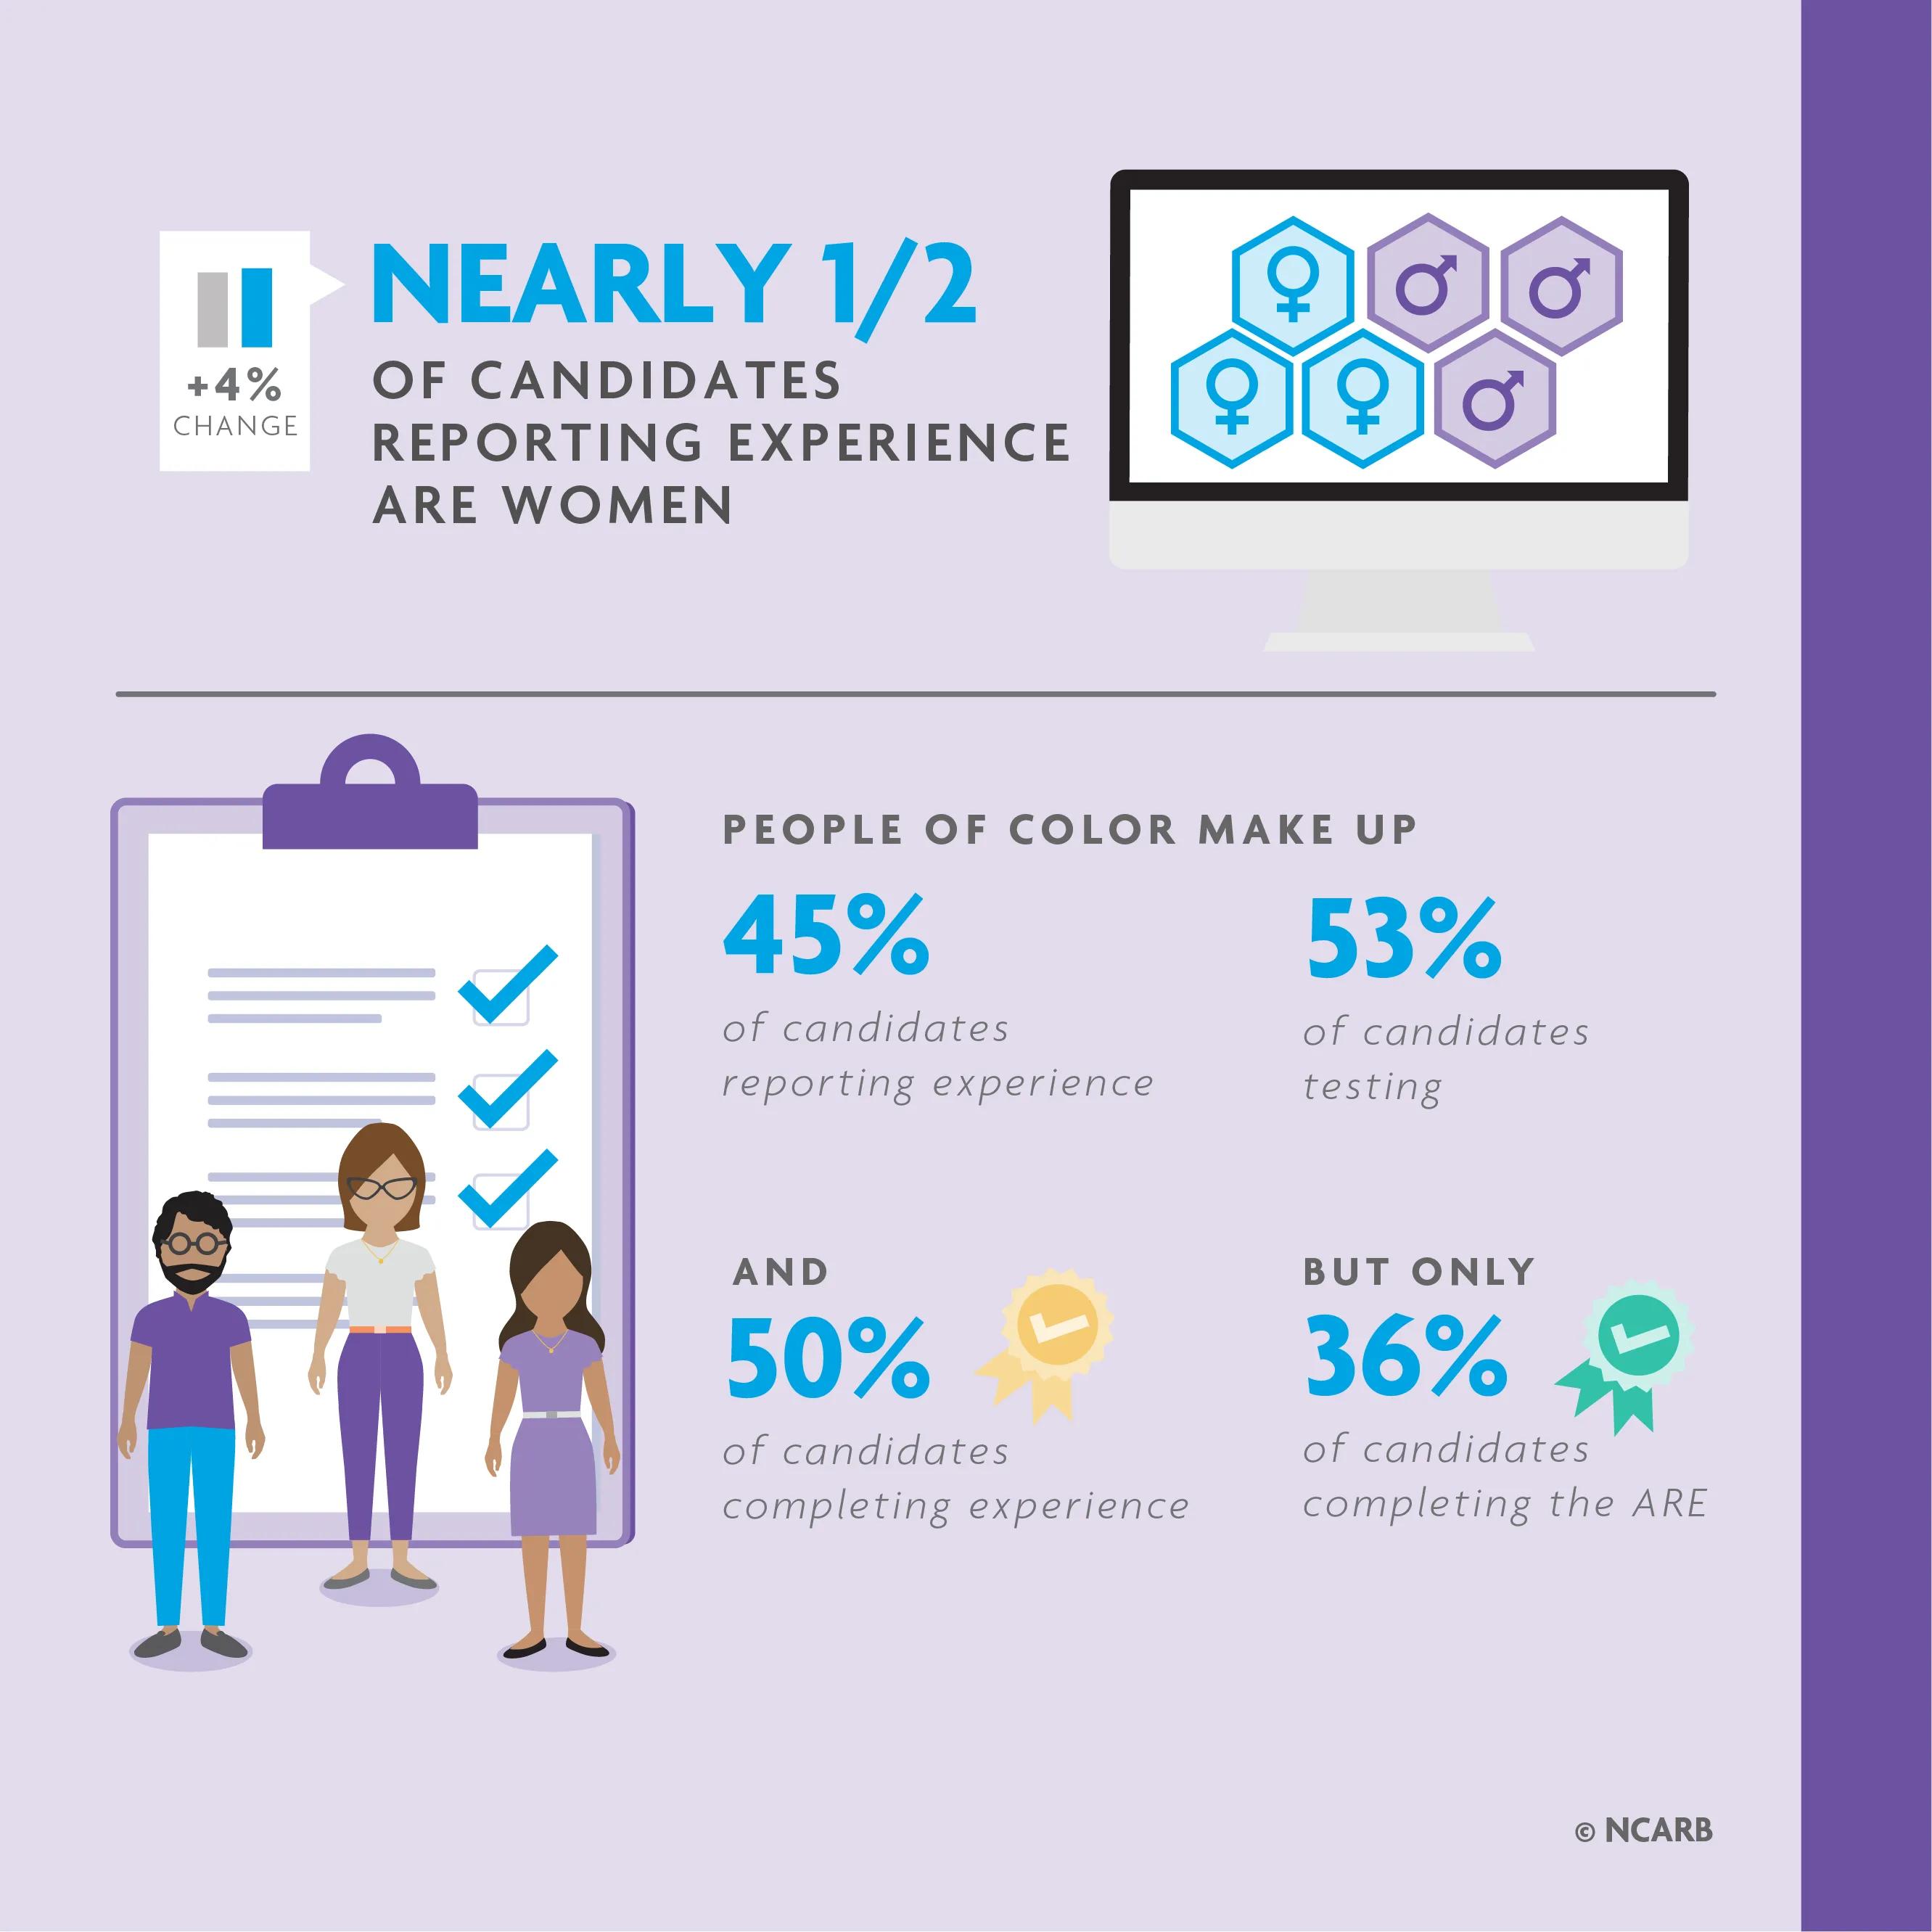
Racial and ethnic diversity continued to increase in early career stages, especially for Asian and Hispanic or Latino candidates: over half of new Record holders and nearly half of candidates reporting experience identified as a race or ethnicity other than white. The candidate population also moved closer to gender parity, with women making up 50% of new Record holders and 49% of candidates reporting experience.
However, diversity slowed at the point of exam completion: 36% of candidates completing the exam identified as a person of color, and 44% identified as female.
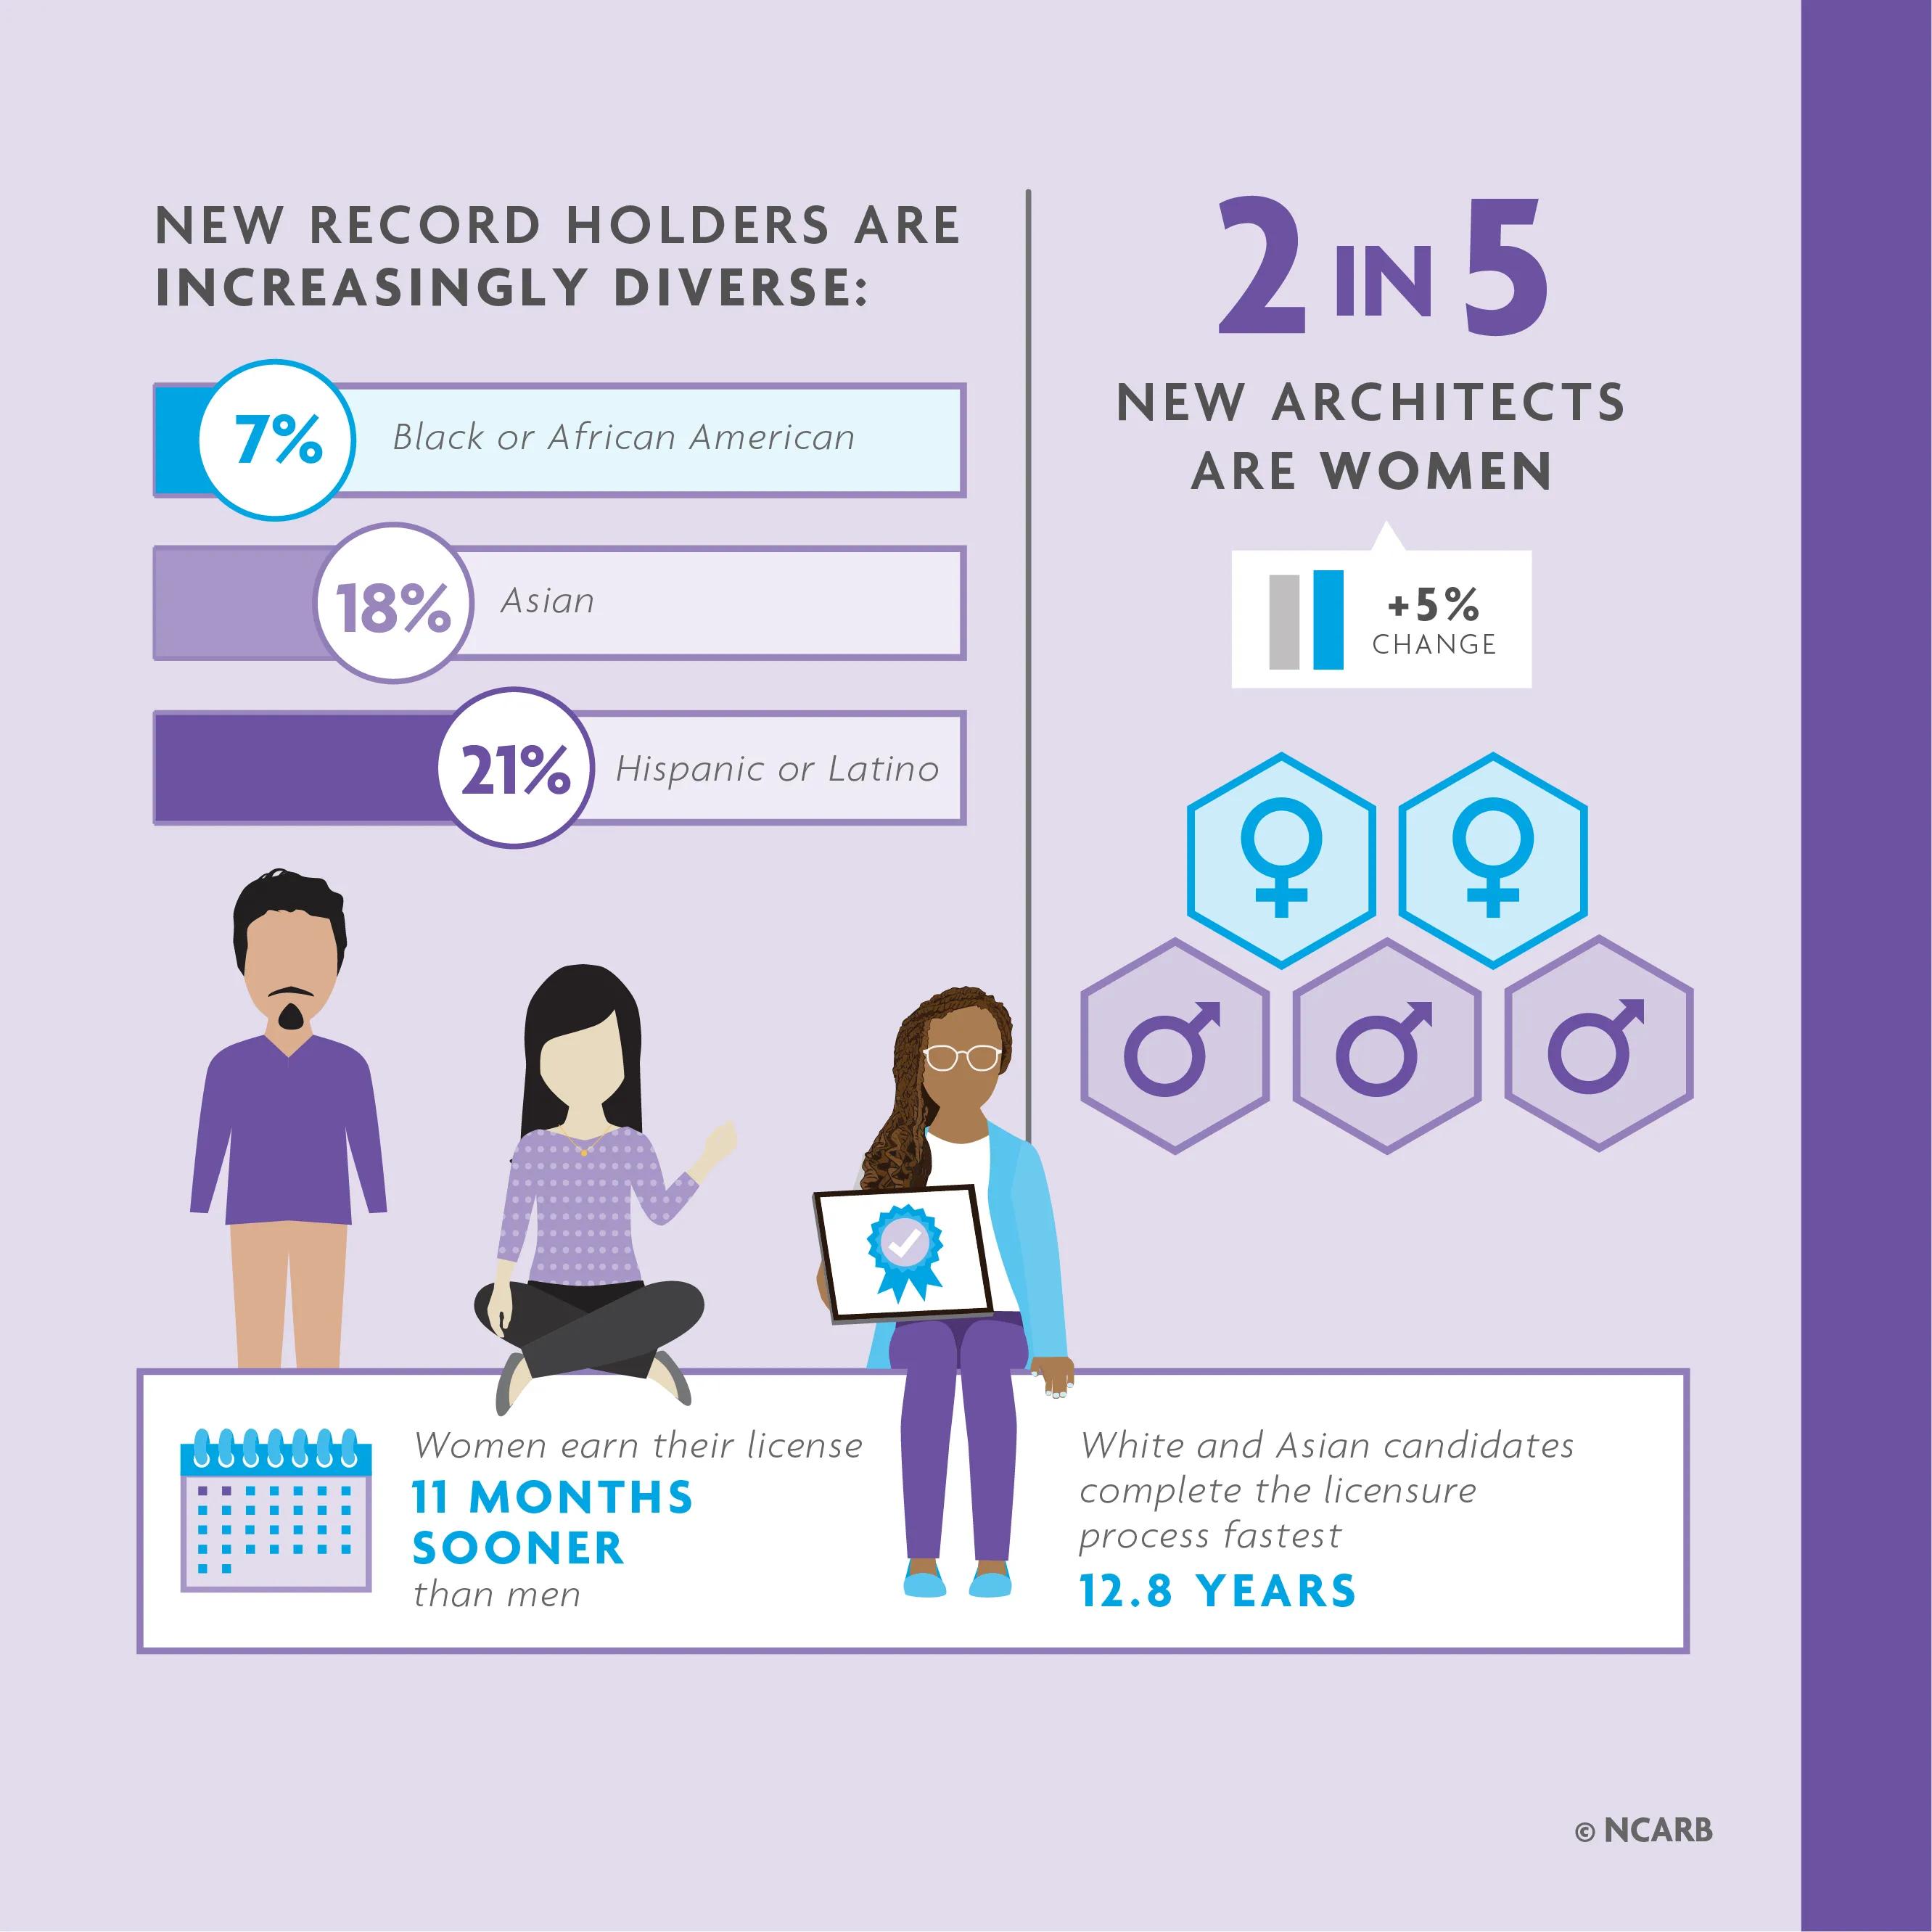
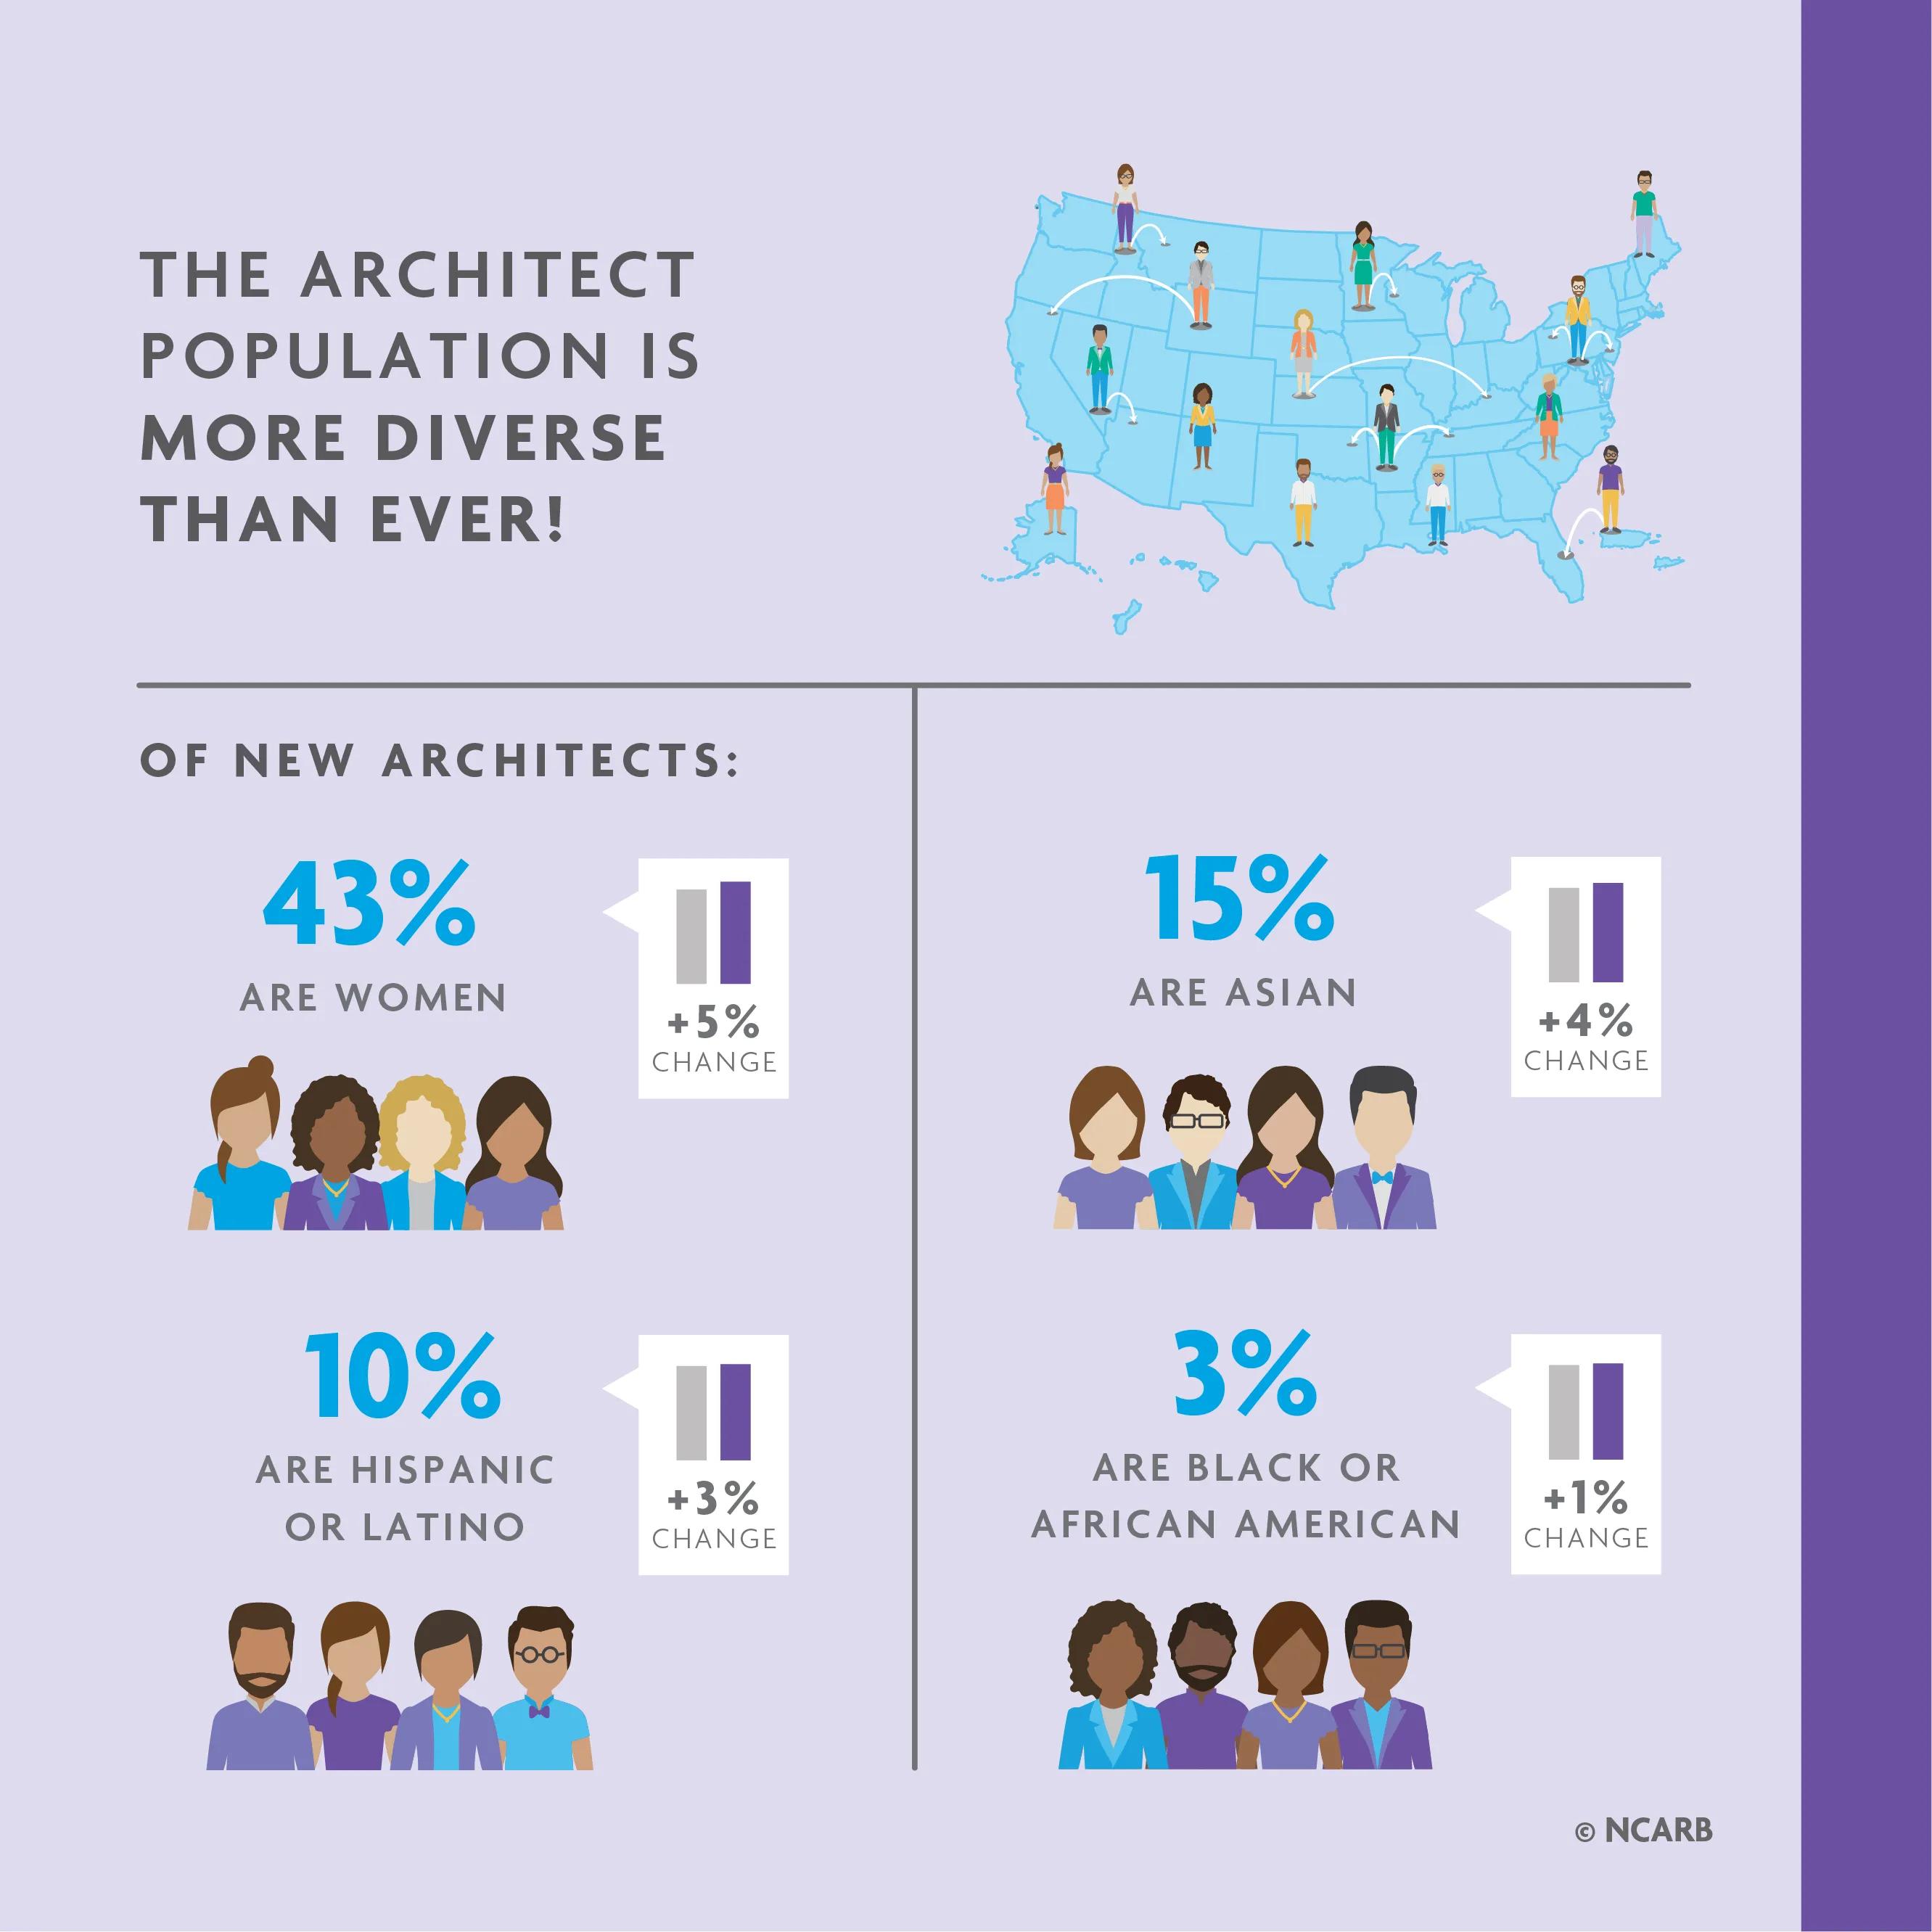
Still, new architects were more diverse than ever in 2022: one out of every three new architects was a person of color, and two out of every five were women.
Note: Because shifts in the demographic makeup of Record holders are gradual, NCARB provides a five-year comparison for this data rather than the typical year-over-year comparison found throughout NCARB By the Numbers. Additionally, because individuals can identify under multiple racial or ethnic categories (for example, white and Hispanic or Latino), some demographic charts may add up to over 100%.
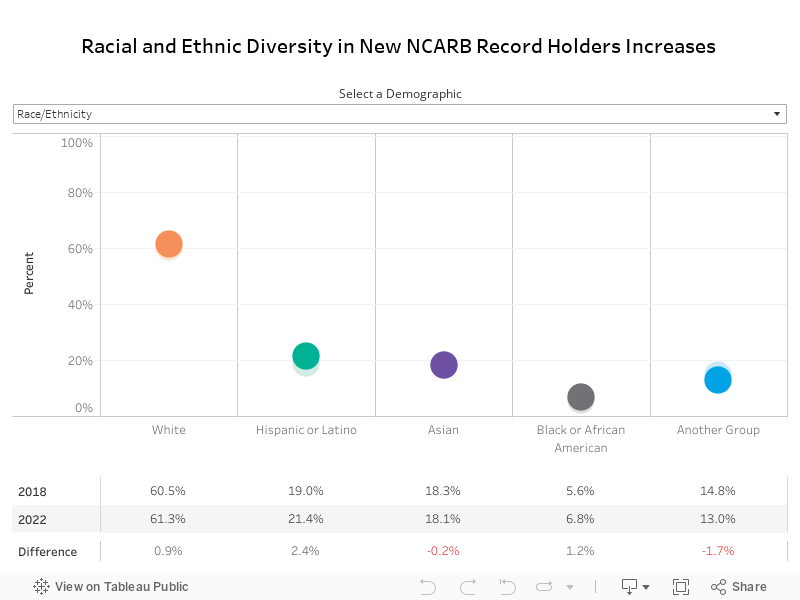
In 2022, nearly 60% of new Record holders identified as a race or ethnicity other than white. Of new Record holders, 21% identified as Hispanic or Latino, 18% identified as Asian, and 7% identified as Black or African American—with individuals who identified as Hispanic or Latino seeing the largest increase across all racial and ethnic groups in the past five years.
Since 2018, there has been a 4 percentage point increase in the proportion of new NCARB Record holders who are women. Correspondingly, the proportion of new male Record holders has decreased, with 50.3% of new Record holders in 2022 identifying as men compared to the 54.5% in 2018.
In 2022, most new Record holders were under 30 years old, showing that overall, candidates are starting the path to licensure younger than ever. The 18-22 age group grew by 5.1 percentage points compared to 2018, now comprising 31% of all new Record holders.
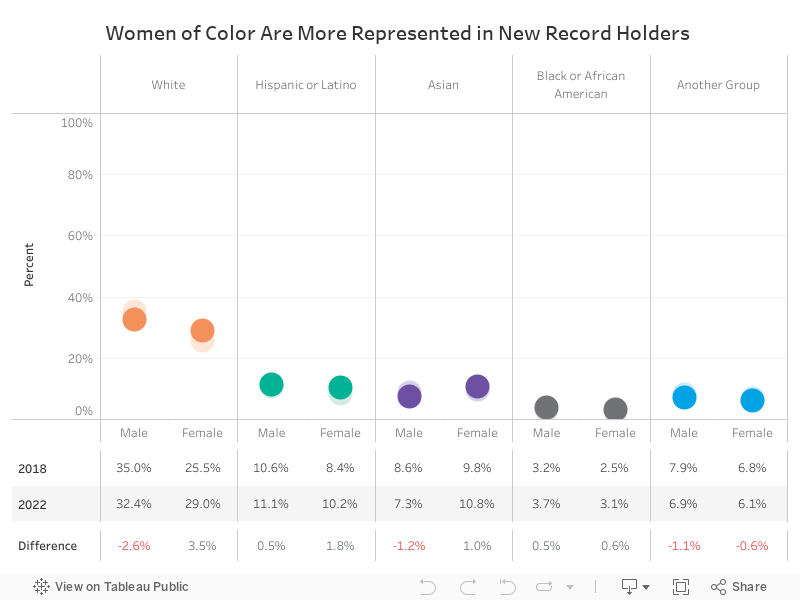
In 2022, white men made up a third of the pool of new Record holders. At 29%, white women were the next most represented group, a 3.5 percentage point increase compared to 2018.
Asian and Hispanic or Latino men made up 7% and 11% of the new candidate pool, respectively, compared to 11% and 10% for Asian and Latina women. Representation for Asian and Latina women increased by 1 and 2 percentage points, respectively, the largest increase after white women.
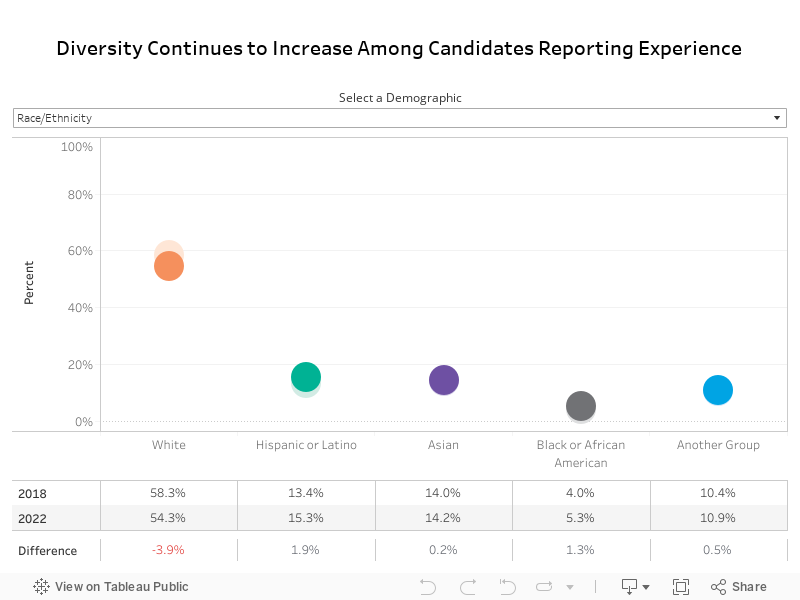
The racial and ethnic diversity seen in the pool of candidates reporting AXP experience has increased by close to 4 percentage points since 2018, with white candidates making up 54.3% of all individuals reporting experience in 2022 compared to 58.3% in 2018. Hispanic or Latino candidates have seen the most growth—they now make up 15.3% of candidates completing the AXP, an almost 2 percentage point increase since 2018.
Similarly, gender representation in the pool of candidates navigating the experience program has also increased in the past five years, with women now making up 49% of candidates reporting experience— near gender parity and a 4.2 percentage point increase in the past five years.
Of candidates reporting experience in 2022, the proportion that were 18-22 years old dropped 4 percentage points compared to 2018. In previous years, candidates reporting experience were younger than ever overall.
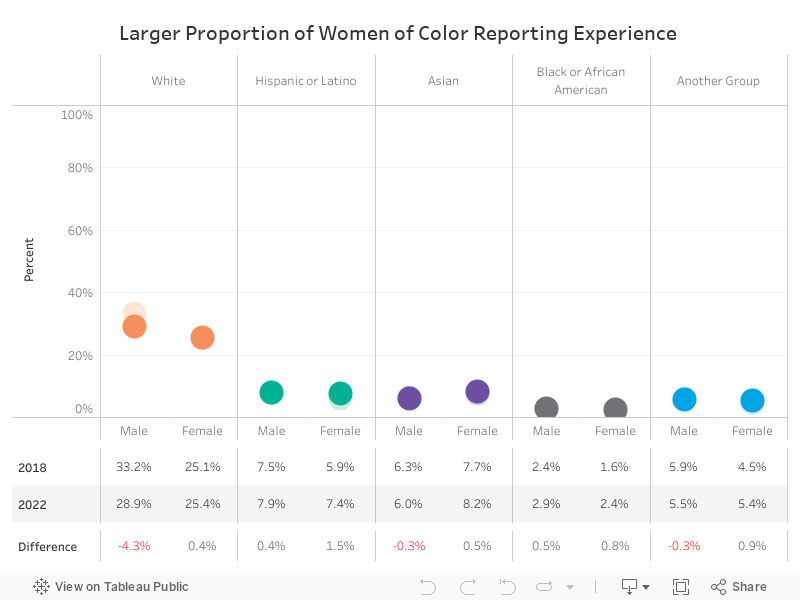
White men made up 29% of candidates reporting experience in 2022, a 4 percentage point decrease compared to 2018. White women made up another 25% (roughly the same as in 2018).
Hispanic or Latina women saw the greatest increase compared to 2018, now making up 7% of candidates reporting experience—a 2 percentage point increase. Black or African American men and women make up 3% and 2% of candidates reporting experience, respectively, a slight increase for both groups.
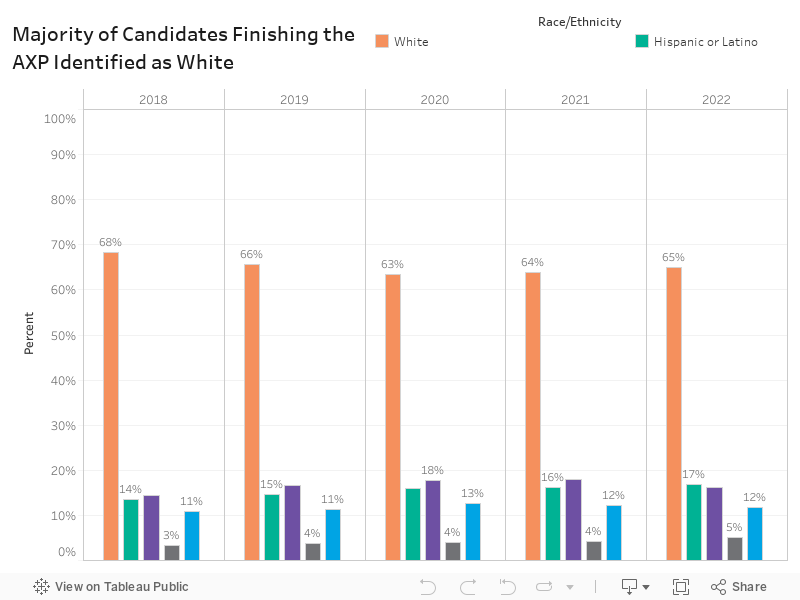
White individuals made up 54% of candidates reporting experience in 2022, but 65% of candidates completing the AXP (down 3 percentage points from 2018).
Hispanic or Latino candidates were the next most represented among candidates who were AXP complete at 17%, with Asian candidates a close third at 16%. Black or African American candidates continue to be underrepresented in the candidate population, only making up 5% of individuals completing the AXP in 2022—a 2 percentage point increase compared to 2018.
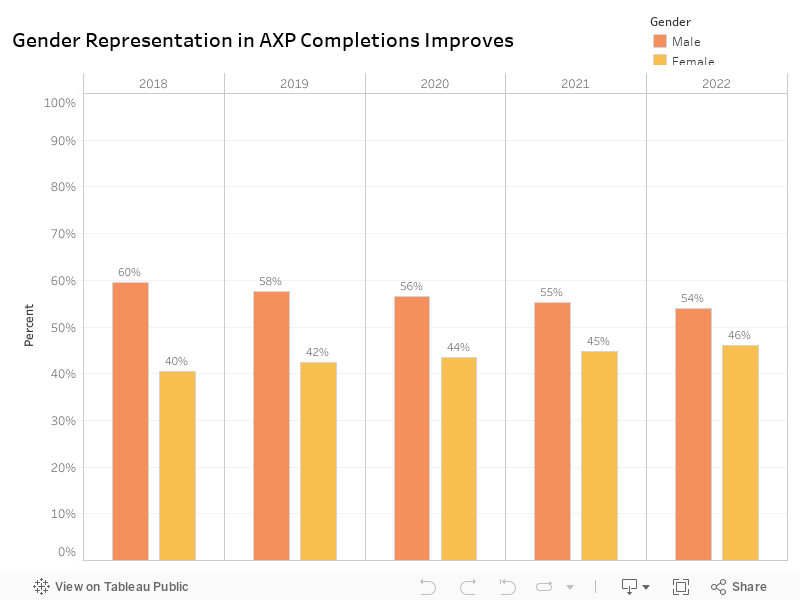
In 2022, women made up 46% of candidates who completed the AXP. This is a 6 percentage point increase since 2018, indicating that the candidate pool is nearing gender equity.
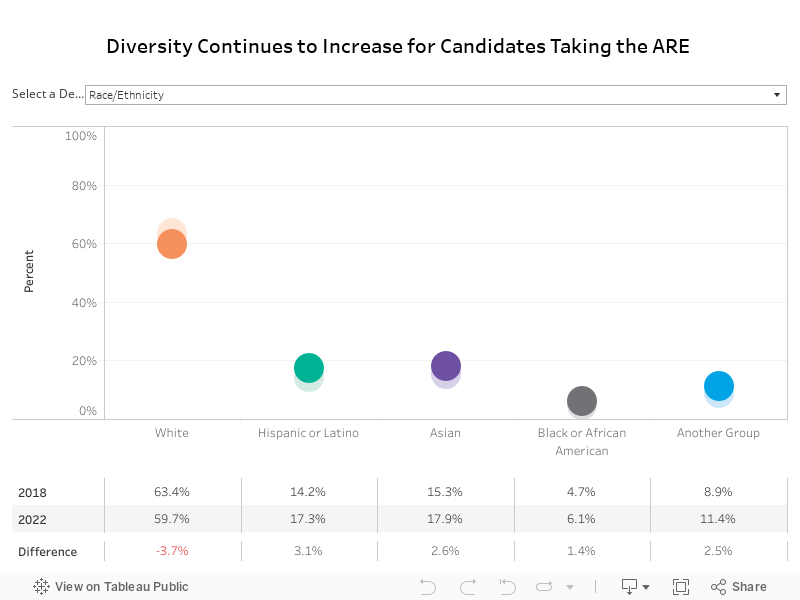
In 2022, white candidates made up 60% of candidates taking the exam, 4 percentage points fewer in 2018. Hispanic or Latino candidates made up 17%, Asian candidates made up 18%, and Black or African American candidates made up 6%— increases of 3, 3, and 1 percentage points, respectively.
Gender diversity among exam candidates has also increased, with women now making up 48% of candidates taking the exam (up 4 percentage points since 2018).
On average, candidates taking the exam in 2022 were slightly older than the pool of candidates seen in 2018, with 40-54-year-olds and candidates 55 or older making up .6 percentage points more of the candidate population.
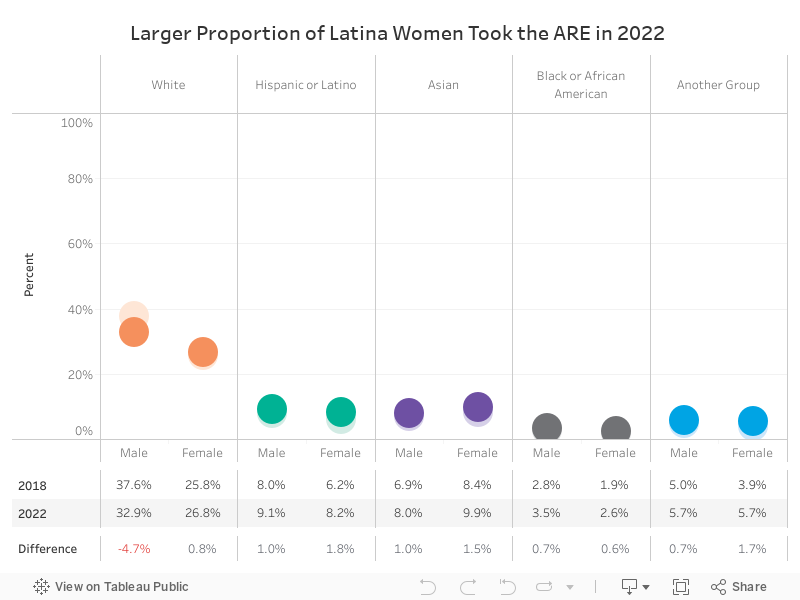
In 2022, white men made up a third of the pool of candidates taking the ARE, 5 percentage points fewer than in 2018. At 27%, white women were the next most represented group.
Asian and Latina women made up 10% and 8% of candidates taking the exam, increases of 2 percentage points each—the largest increases seen across all racial and ethnic groups over the past five years. At 3.5% and 2.6%, Black or African American men and women make up .7 percentage points more of the exam candidate population each compared to 2018.
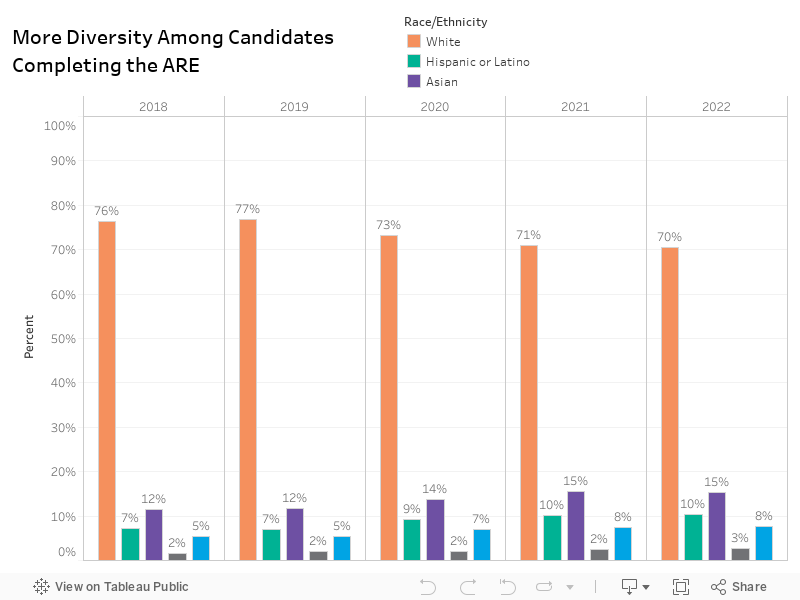
While white candidates made up 60% of candidates taking the ARE in 2022, they represented 70% of candidates passing the ARE—a decrease of 6 percentage points since 2018.
Meanwhile, the proportion of candidates passing the ARE who identify as Black or African American (3%), has only seen a 1 percentage point increase since 2018. Ten percent of candidates who passed the ARE identified as Hispanic or Latino and 15% identified as Asian, with both groups seeing a 3 percentage point increase in the past five years.
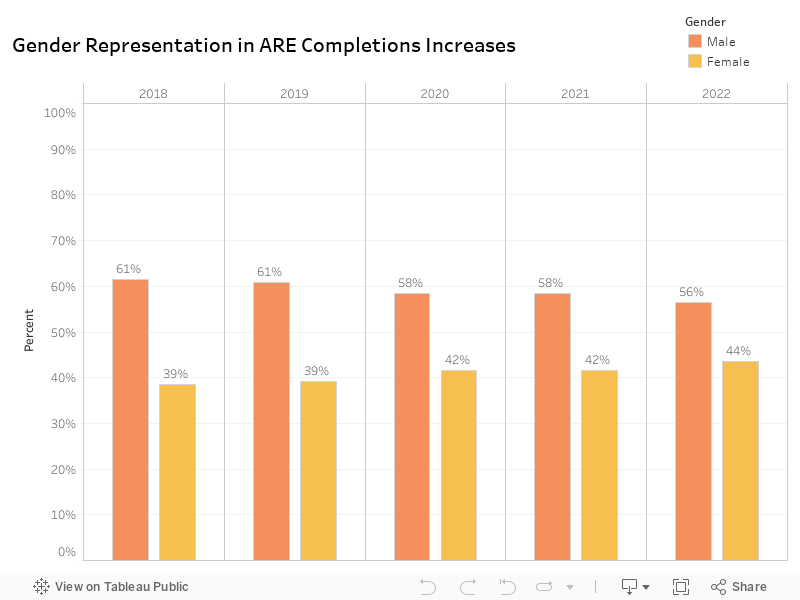
Women made up 44% of candidates completing the ARE in 2022, compared to 39% in 2018— a 5 percentage point increase. This is the largest proportion of women completing the exam on record.
While white candidates made up 54% of candidates reporting experience and 60% of candidates taking the exam in 2022, they represented a significantly larger proportion of candidates who completed the path to licensure in 2022 (71%).
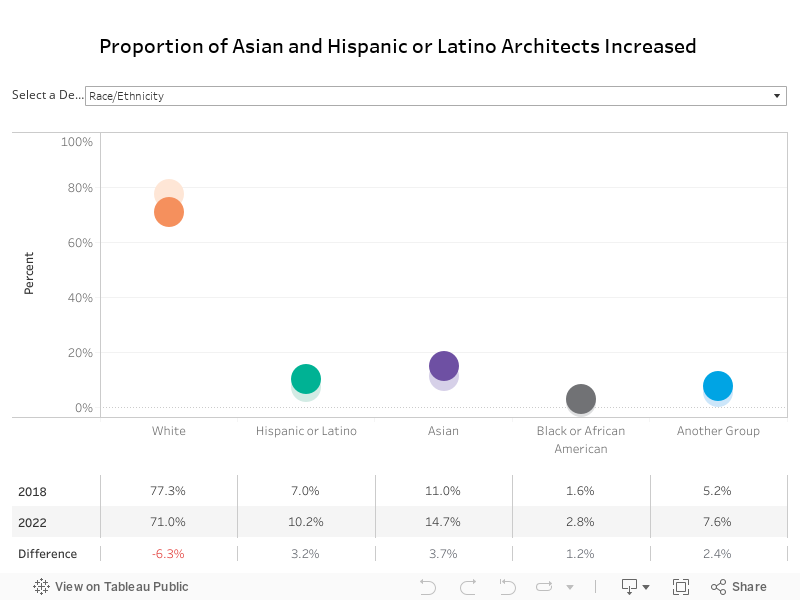
Asian candidates made up nearly 15% of individuals completing the path to licensure in 2022, a 4 percentage point increase compared to 2018. Hispanic or Latino candidates made up nearly 10% of new architects, and individuals who identify as some other race or ethnicity (such as Native American or Pacific Islander) made up 7.6%. Black or African American individuals continue to be the least represented in the population of new architects at 2.8%, a 1 percentage point increase compared to 2018.
The proportion of men in the new architect population has continued to be larger than that of women. However, it is nearing gender parity, with women now making up 43% of the architect population, a 5 percentage point increase compared to 2018.
Half (50%) of new architects are between the ages of 30-39, with a further 29% between the ages of 23-29. Of the remaining new architects, 18% are aged 40-54, and 3% are 55 or older.
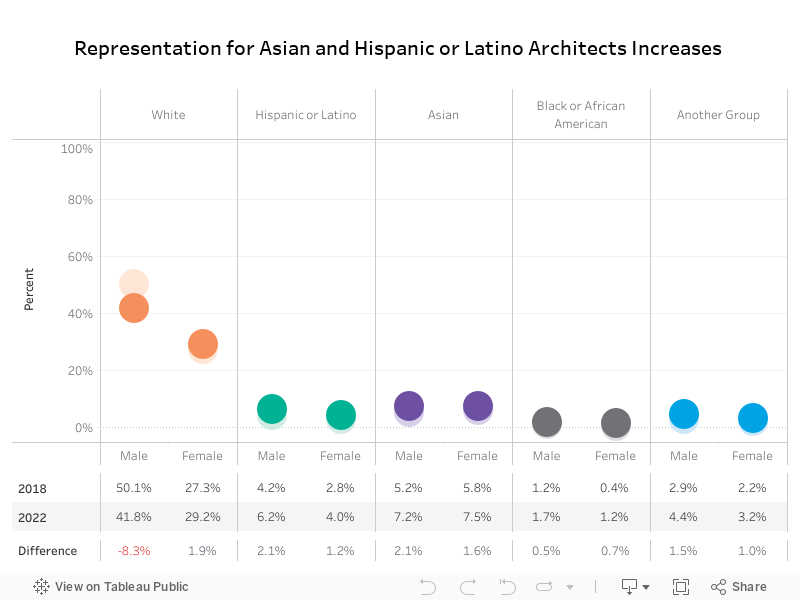
White men made up 42% of the new architect population, a decrease of 8 percentage points since 2018. White women were the next most represented group at 29.2%, a 2 percentage point increase since 2018. Asian and Hispanic or Latino men have seen the most growth in the past five years, with both groups increasing by 2 percentage points.
Black or African American women continue to be the most underrepresented group at 1.2% of the new architect population, a .8% increase since 2018.
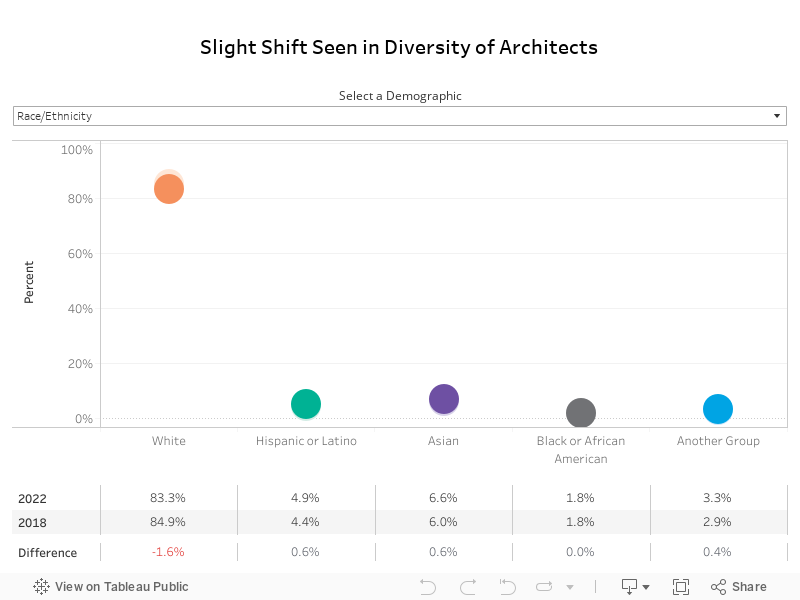
While the diversity of earlier career stages continues to grow, the makeup of the architect population is slower to shift. Approximately 83% of NCARB Certificate holders identified as white in 2022, a 2 percentage point decrease since 2018.
Asians made up 6.6% of all NCARB Certificate holders in 2022. Hispanic or Latino architects made up 4.9%, and Black or African Americans made up 1.8%— showing minimal change since 2018.
Female architects now make up nearly a quarter of the Certificate holder population, a 2.6 percentage point increase compared to 2018.
NCARB has seen a slight decrease in younger Certificate holders over the past five years. NCARB Certificate holders in the 23-29 age group saw a decrease by 1 percentage point since 2018, now 1.2%. Those in the 30-39 age group saw a decrease of 1.1 percentage points, with the 40-54 age group seeing no change at all. Of all age groups, individuals 55 and over saw the most growth with a 2 percentage point increase since 2018, now comprising of 45% of the Certificate holder population.
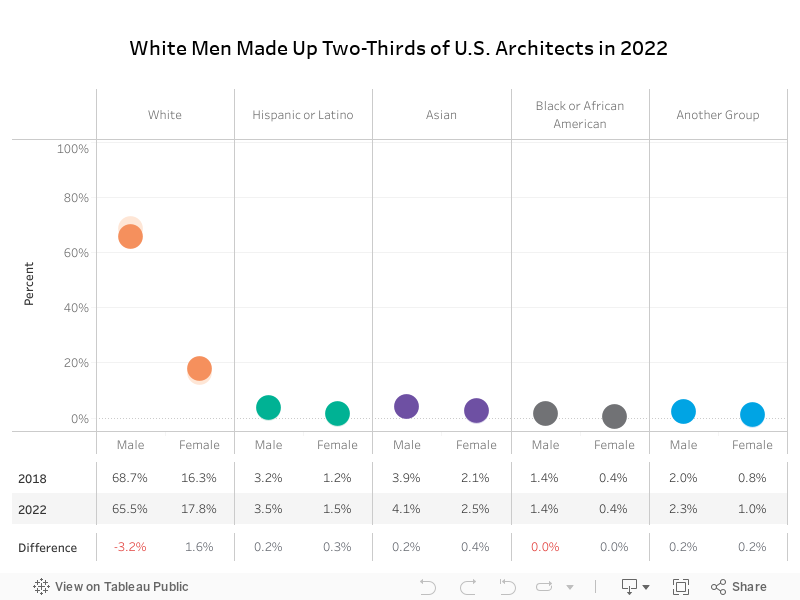
White men made up 66% of NCARB Certificate holders in 2022, a decrease of 3 percentage points compared to 2018. White women are the next most represented group at 18%, and Asian men are a distant third at 4%.
At .4% of NCARB Certificate holders, Black or African American women continue to be the least represented demographic group in the architect population—with no increase since 2018.
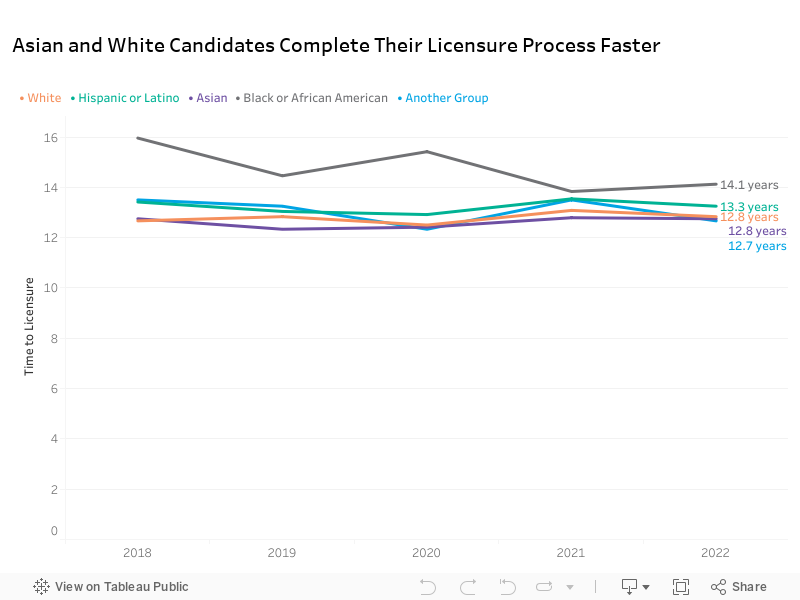
On average, Asian and white candidates who completed the path to licensure in 2022 took 12.8 years to do so. Hispanic or Latino candidates took an average of 13.3 years, approximately six months longer. On average, Black or African American candidates took 14.1 years to complete the path to licensure in 2022, close to a year and five months longer than their white and Asian peers.
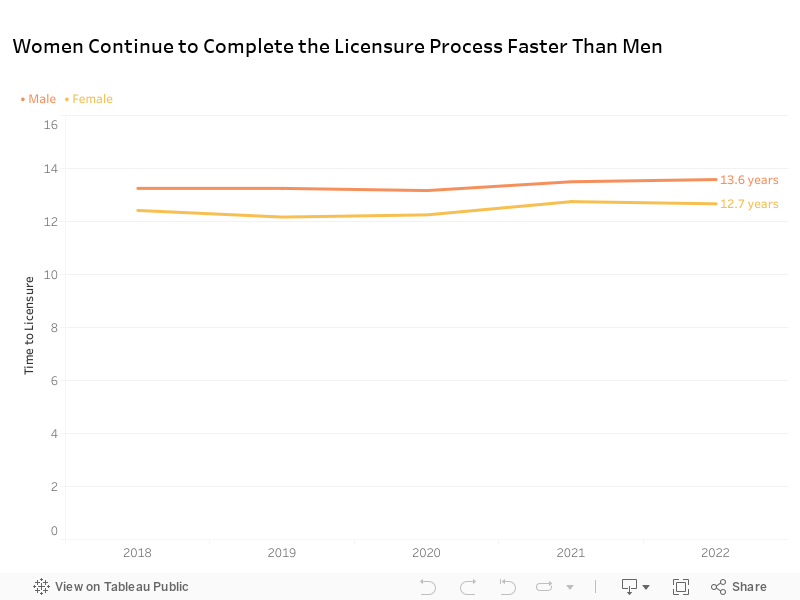
The average woman completing the licensure process in 2022 took 12.7 years—11 months faster than the average man who completed the licensure process in 2022. Over the past five years, women have consistently earned their licenses in less time than their male peers.