Each year, NCARB by the Numbers highlights data from the previous calendar year—for example, the 2022 edition of this publication features data as of December 2021. However, NCARB's goal is to provide a constant stream of live data on the path to licensure.
The charts in this section reflect live data that updates each month during the 2022 calendar year. This data may shift throughout the year based on ongoing current events and other trends. Numbers from previous years (for instance, 2021's data) may also shift slightly, as candidates backdate experience reports or other program information.
For charts that display the number of candidates or program completions, numbers viewed early in the year are expected to be much smaller than the final, year-end total seen in December. For charts based on averages, it is important to remember that the number of data points from which the average is calculated will be much larger toward the end of the calendar year.
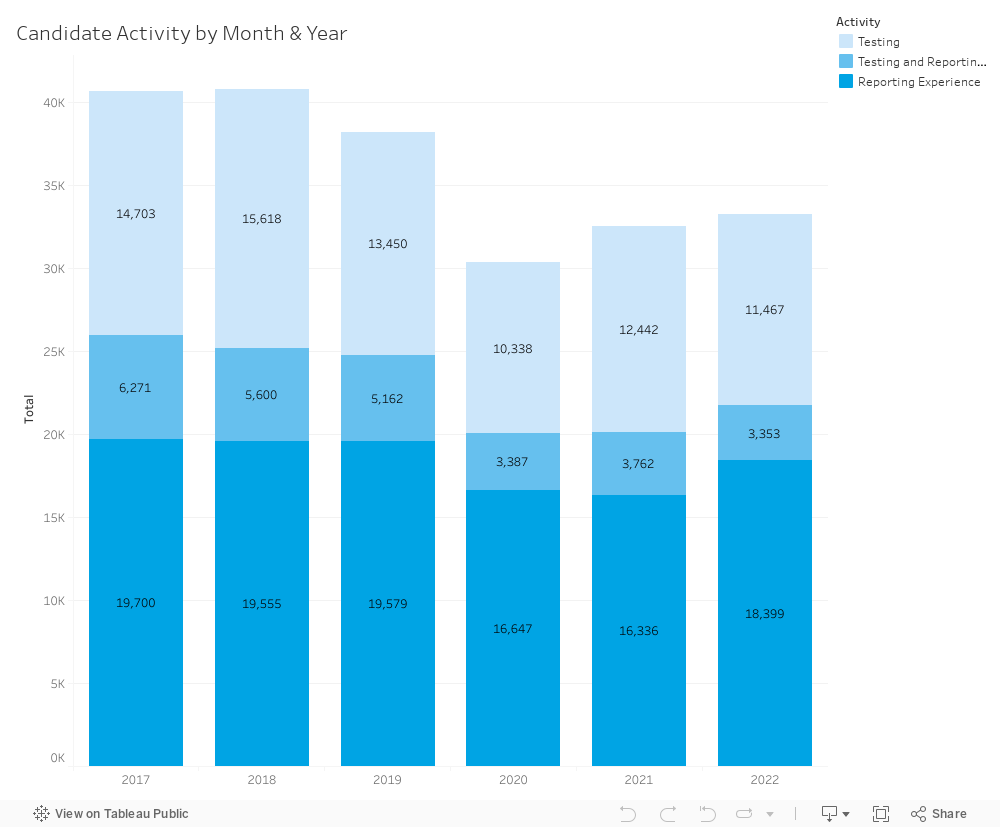
This chart shows the total number of candidates actively working toward licensure during the year by reporting experience toward the Architectural Experience Program® (AXP®), taking a division of the Architect Registration Examination® (ARE®), or both.

This chart shows the number of candidates who completed the experience program during each month of the year so far, compared to the number seen per month in 2021, 2020, and the average seen per month in 2017-2019. Note: This data may shift as candidates can report experience up to five years in the past. For example, if someone today submitted a final experience report from 2017, their AXP completion date would be 2017.
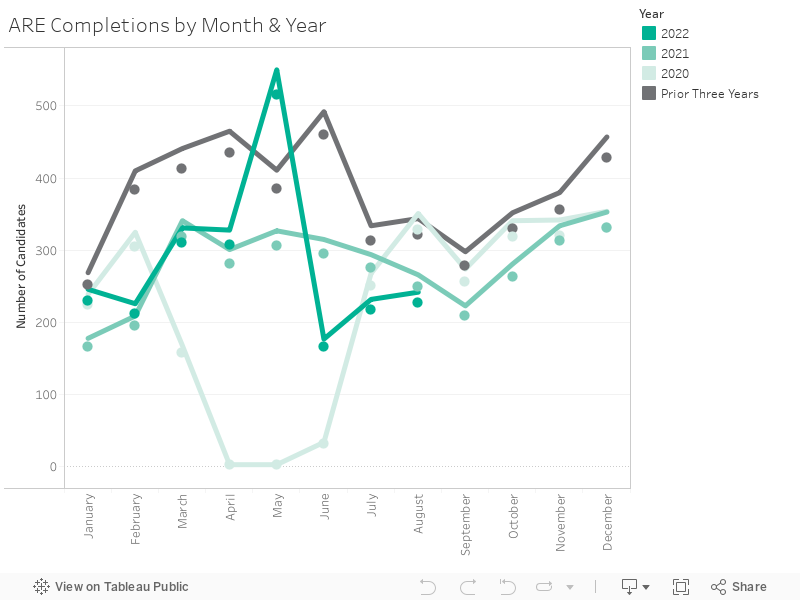
This chart shows the number of candidates who completed the ARE during each month of the year so far, compared to the number seen per month in 2021, 2020, and the average seen per month in 2017-2019.

This chart shows the pass rate for each division of the ARE in the 2022 calendar year compared to the pass rates seen in 2021. A pass rate measures the percentage of successfully passed divisions out of the total number of attempts on that division.

This chart shows the total number of candidates who completed the path to licensure during each month of the year so far, compared to the number seen per month in 2021, 2020, and the average seen per month in 2017-2019. Completing the path to licensure is a key measure of NCARB’s mission to facilitate licensure. To earn a license in the United States, applicants typically complete education (a degree from a NAAB-accredited program), experience (the AXP), and examination (the ARE). Some jurisdictions have additional requirements, such as additional experience.

This chart shows the total number of individuals who created an NCARB Record during each month of the year so far, compared to the number seen per month in 2021, 2020, and the average seen per month in 2017-2019. Creating an NCARB Record is often the first step toward completing the experience and examination components of the licensure process.