
Assessing when and why candidates stop pursuing a license is a crucial part of understanding the impact licensure requirements have on emerging architecture professionals. Understanding how attrition varies across demographic groups also allows NCARB to discern areas where candidates may face unintended impediments on the licensure path.
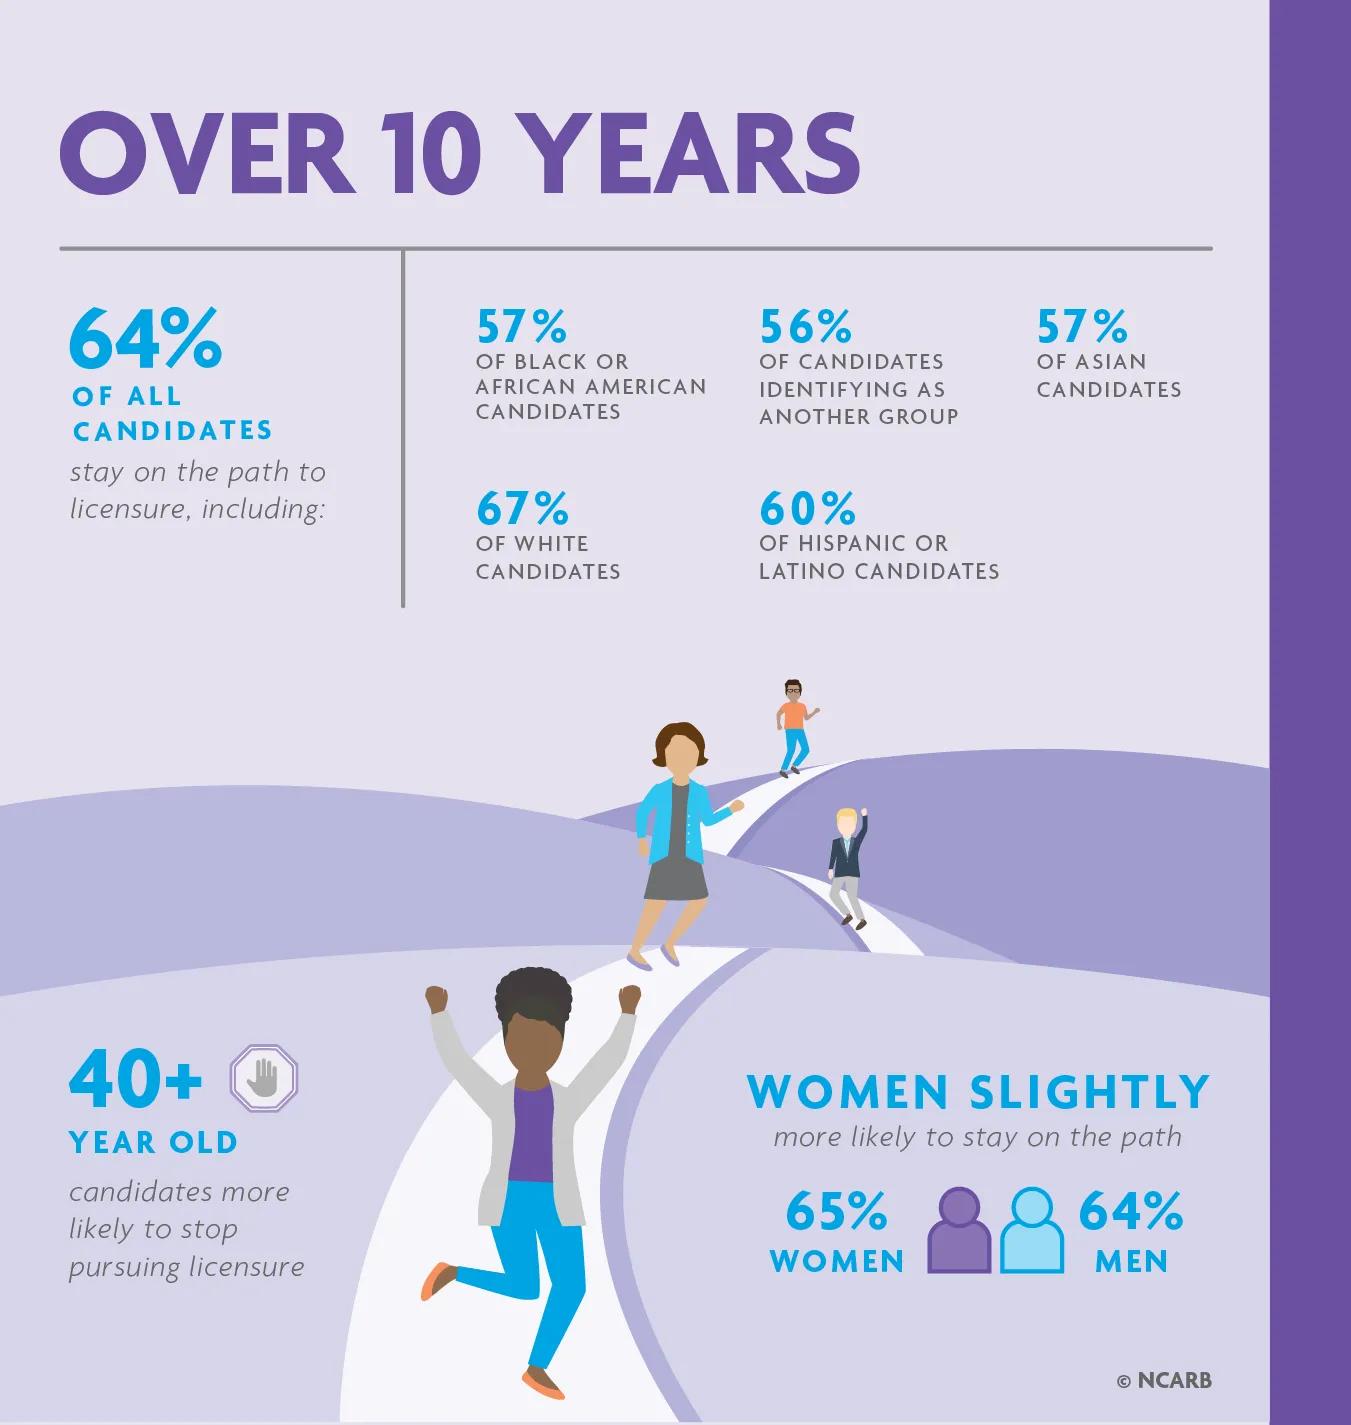
By 2021, 36% of candidates who started the licensure path a decade ago had stopped pursuing a license, with the remaining 64% having completed or still working on their licensure requirements. This represents a slight (one percentage point) improvement compared to attrition seen in 2020. Most candidates who fell off the path did so before starting NCARB programs or while working to gain and report experience.
Of candidates who started working toward an architecture license in the last five years, women are more likely to stay on the path. Younger candidates (18-29 and 30-39 age group) are also more likely to stay on the path than their 40+ counterparts. Across the years, white candidates remain the least likely racial and ethnic group to fall off the path, with disparities between candidates of different racial and ethnic groups seen as soon as two years into the licensure process. The gap between races and ethnicities does begin to shrink, however, for candidates who started the path in 2012 and later.
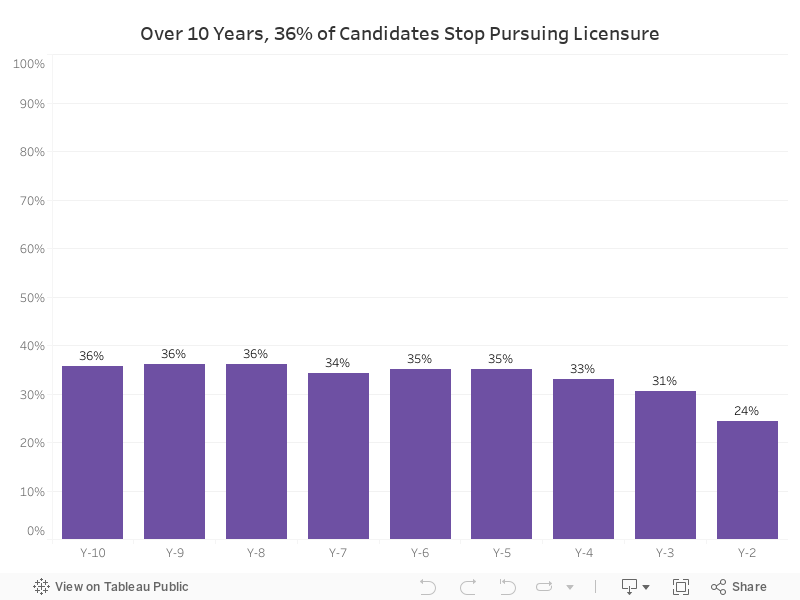
Of candidates who created an NCARB Record 10 years ago (Y-10), 36 percent stopped working toward earning a license.
2021’s attrition rate at the 10-year mark (candidates who started working toward an architecture license in 2012) is the same rate of attrition seen after a decade in 2020 and 2019, indicating a potential slow in candidate attrition.
High attrition numbers are likely impacted by the effects of the COVID-19 pandemic on the profession, as the numbers of candidates reporting experience and taking the exam dropped during 2020.
Note: Candidates who started their NCARB Record in 2021 are defined as active (because they started a record in that calendar year), and not represented on this chart.
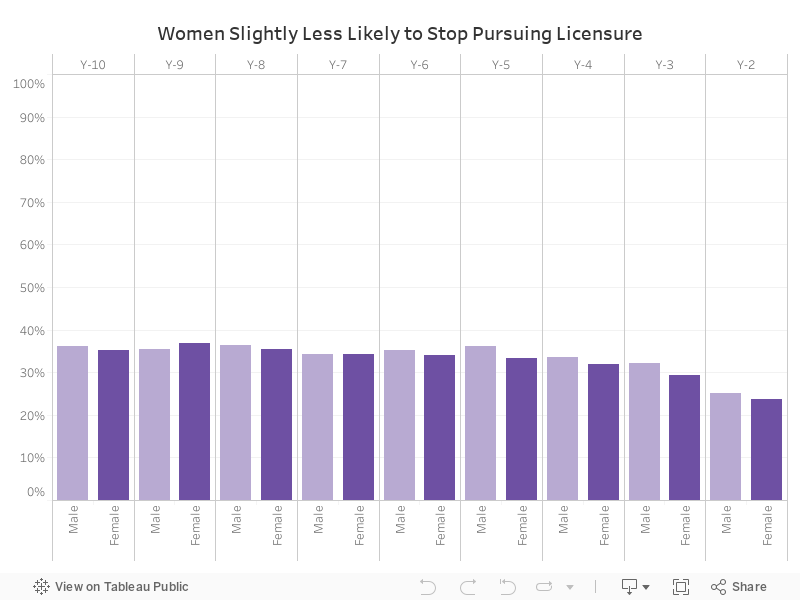
Historically, women have left the path to licensure at higher rates than men. In the last decade, however, the trend has started to reverse, with women slightly less likely to fall off the path than men in recent years. Among candidates who started the path to licensure in the last five years, the proportion of women leaving the path is 1-3 percentage points fewer than the proportion of men, similar to the attrition levels seen in last year’s report.
While NCARB’s demographic data shows that there is still work to be done to achieve equal gender representation in the profession, continued lower rates of female attrition on the path to licensure should help address this historical imbalance over time.
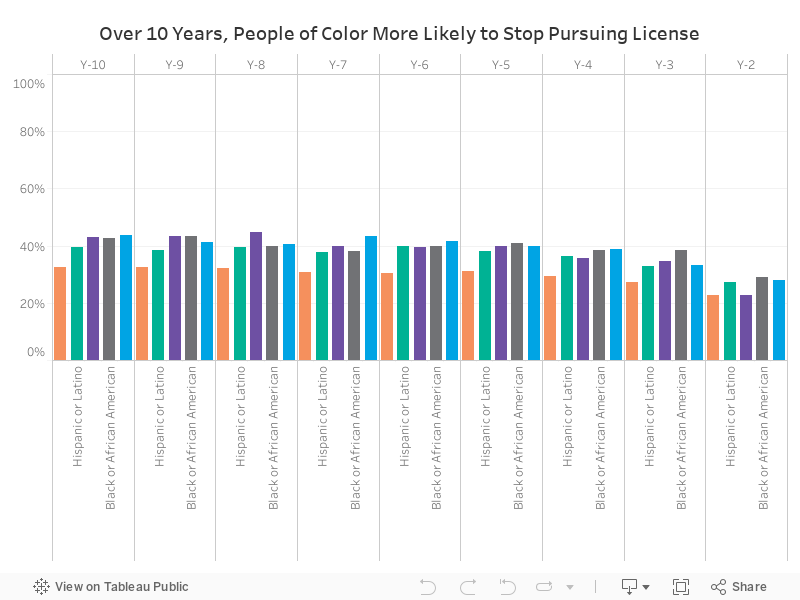
While disparities have reduced slightly among more recent cohorts, white candidates consistently leave the path at the lowest rate every year. The gap in attrition between racial and ethnic groups is seen as soon as two years into the licensure process, with 29% of Black or African American candidates who started a Record in 2020 having already stopped pursuing licensure, compared to 23%of white and Asian candidates.
Of those who started an NCARB Record a decade ago (in 2012), 33% of white candidates stopped pursuing a license compared to 44% of those who selected “other” when asked to indicate a race or ethnicity—an 11 percentage point gap.
When combined with results from NCARB and NOMA’s joint Baseline on Belonging study, these disparities suggest that candidates of color face specific impediments along the path starting early in their careers, which build up as they progress toward licensure.
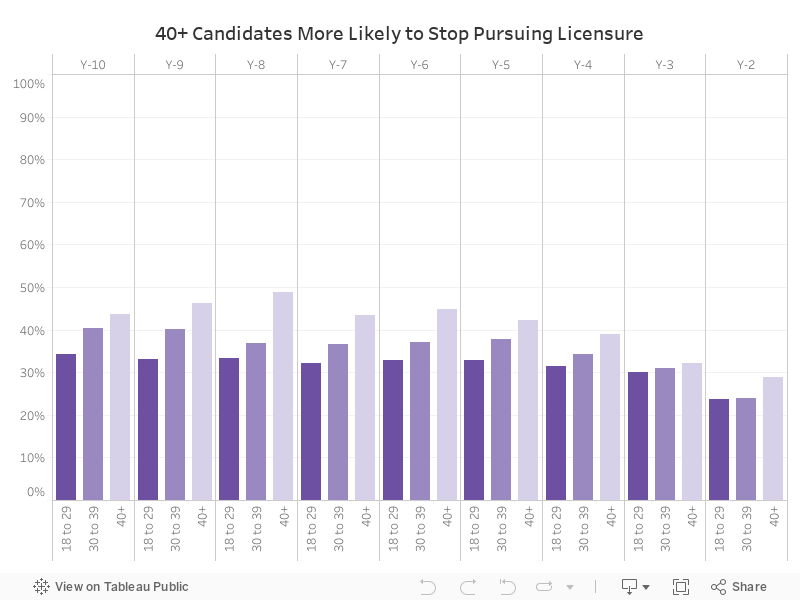
Candidates between 18-29 years old are more likely to stay on the path to licensure compared to candidates aged 30-39 and 40+.
Regardless of when they started their NCARB Record, data from the past decade shows that candidates over 40 are the most likely age group to stop pursuing a license. Of those who started the path to licensure a decade ago (2012), 44% of candidates 40 and older have since fallen off the path to licensure—10 percentage points more than those aged 18-29.
Combined with findings from NCARB and NOMA’s joint Baseline on Belonging survey, this data highlights the difficulties faced by candidates who start the licensure process later in life, or who return to the licensure path after having stopped pursuing a license previously in their careers.
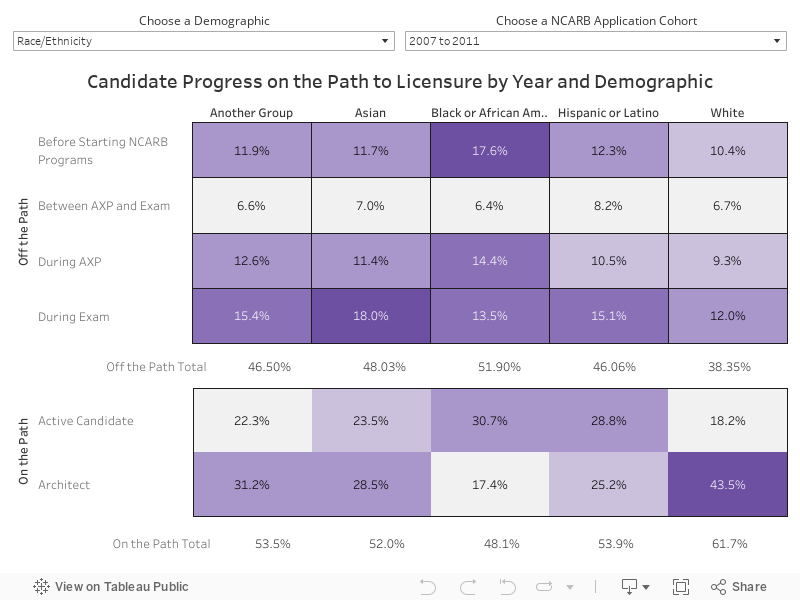
How to read this chart: Use the drop-down menus at the bottom of the chart to select the demographic filter and NCARB application years* you would like to view. The chart will display the individual groups within that filter for both inactive candidates (off the path) and active candidates (on the path), with total figures for each demographic group indicated under the corresponding column. *NCARB application years refers to the time period in which a candidate first applied for an NCARB Record.
Attrition by Gender
For candidates who started the path to licensure more than a decade ago (between 2007-2011), women were 6 percentage points more likely to fall off the path to licensure than men 45% vs. 39%). Both men and women who started the licensure path between 2007-2011 were most likely to fall off the path while taking the ARE. 35% of women and 40% of men who started the licensure path between 2007-2011 are now licensed architects.
The attrition seen between men and women shifts for candidates who started the path to licensure between 2012-2016, with equal proportions of men and women falling off the path at 35%—typically while gaining professional experience or testing for the ARE.
For candidates who recently started the path to licensure (2017-2021), men were slightly more likely to fall off the path than women at 26%. Women who recently started the path are also more likely to be actively pursuing an architecture license at 74%, versus 69% of men.
Attrition by Race and Ethnicity
Greater disparities are seen when candidate progress and attrition is viewed by race and ethnicity. Across the years, white candidates remain the least likely racial and ethnic group to fall off the path. The gap between races and ethnicities does begin to shrink, however, for candidates who started the path in 2012 and later.
For candidates who started the path to licensure between 2007-2011, there was a 14 percentage point gap between the least likely group (white candidates) and the most likely group (Black or African Americans candidates) to fall off the path. Additionally, 18% of African Americans fell off the path before starting NCARB programs. Asians were the next most likely group to fall off the path, typically while taking the exam.
For candidates who started their licensure journey slightly later (between 2012 and 2016), the gap between the least likely group (white candidates) and the most likely group (Asian candidates) is approximately 10 percentage points. Additionally, these candidates were most likely to fall off the path while earning professional experience.
For those who recently started the path to licensure (2017-2021), 71-77% of individuals across racial and ethnic groups are still active on the path. Those who selected “another group” when asked to indicate their race and ethnicity were the most likely to fall off the path at 29%, closely followed by African American and Asian candidates, both at 28%. Most candidates that fell off the path did so before starting NCARB programs or while working to gain and report experience.
Attrition by Age
Across the years, younger candidates (18-22 and 23-29) are less likely to fall off the path to licensure than candidates aged 40+.
For candidates who started the licensure path between 2007-2011, candidates aged 40-54 were 11 percentage points more likely to fall off the path than 23-29-year-old candidates (51% vs. 40%). Additionally, a high proportion of 55+ candidates (22%) fell off the path before starting NCARB programs.
For those who started the licensure path slightly later (2012-2016), the gap between the least likely and most likely age group to fall off the path widens: candidates aged 55+ were 23 percentage points more likely to fall off the path than 18-to-22-year-old candidates (55% vs. 32%). Most individuals—especially 40+ candidates—fell off the path while taking the ARE.
The attrition seen between age groups decreases for those who started the path to licensure more recently (2017-2021), with 22-31% of individuals across age groups falling off the path. Most candidates fell off before starting NCARB programs, with 40-54 and 55+ individuals the most likely to become inactive.

How to read this chart: Use the drop-down menu at the bottom of the chart to view candidate progress on the path to licensure filtered by the number of years (0Y – 12Y) a candidate has been active. You may need to make this chart full screen in order to interact with it.
Most candidates in their first year of working toward an architecture license were recording professional experience (60%) and/or earning a degree (27%)—often the first steps toward becoming a licensed architect.
When viewing candidates in their fifth year on the path, progress is more evenly spread out:
- 25% taking the ARE
- 25% no activity
- 26% inactive
- 28% earning hours toward experience
Of Record holders in their tenth year on the path to licensure, 39% did not renew their Record (inactive) and 23% did not report any progress toward NCARB programs (no activity). These increases in attrition were likely impacted by challenges in the profession brought on by the COVID-19 pandemic. 30% of active Record holders in their tenth year, however, had completed their licensure requirements.
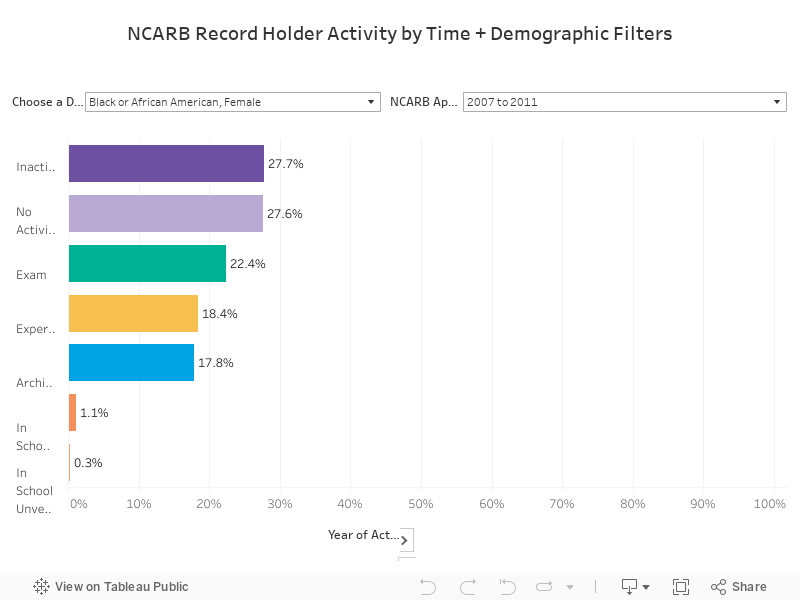
How to read this chart: Use the drop-down menus at the top of the chart to select the active year filter by the NCARB application years*, demographic, and specific segment you would like to view. Use the drop-down menu at the bottom to view the chart by the number of years a candidate has been active (that is, years since starting an NCARB Record). You may need to make this chart full screen in order to interact with it.
*NCARB application years refers to the time period in which a candidate first applied for an NCARB Record.
To dig deeper into candidate progress and attrition on the path to licensure, use our interactive chart to see the proportions of candidates from different demographic groups at various stages of the licensure path.