
This year, NCARB has adjusted the way we present data around racial and ethnic diversity to reflect the fact that individuals can identify as more than one race or ethnicity. For this reason, some percentages in this section may add to over 100%.
Racial and ethnic diversity continues to increase in early career stages, especially for Asian and Hispanic or Latino candidates. Despite this, white candidates (and Asian candidates, to a lesser degree) continued to be overrepresented in the pool of individuals completing the AXP and ARE in 2021, compared to the overall population of candidates working toward completing those programs.
While the population of new Asian and Hispanic or Latino architects—especially Asian women—rose in 2021, the proportion of new architects who identify as Black or African American has remained relatively stable over the past five years. Black or African American women continue to make up less than 1% of the total architect population in the United States.
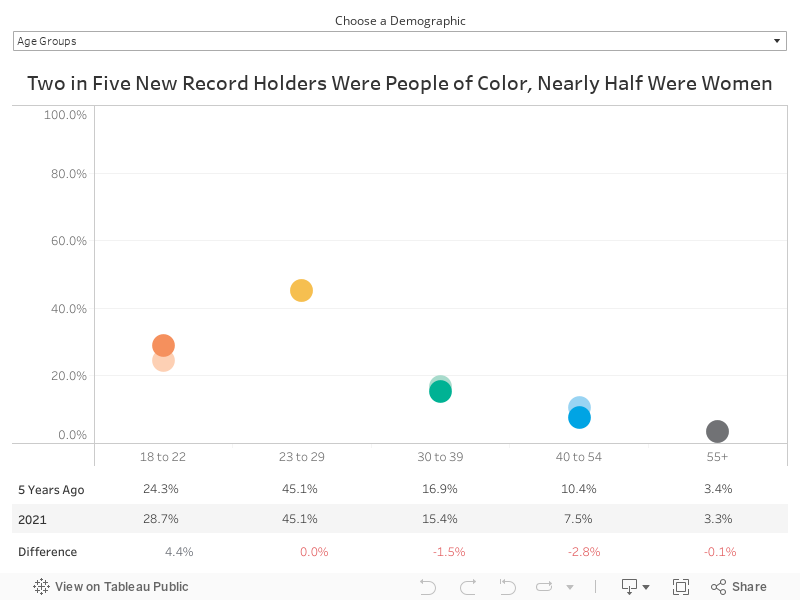
How to read this chart: Use the drop-down menu at the top of the chart to select the demographic filter you would like to view. The chart will display the individual groups within that filter, with the darker dot for each group showing the 2021 data and the lighter dot showing the 2017 data (a five-year lookback). The table at the bottom provides exact figures for each group, as well as the percentage point increase or decrease since 2017.
NCARB considers starting a Record to be one of the first steps on the path to licensure, since candidates need an NCARB Record to verify their education, document experience, and take the national licensing exam.
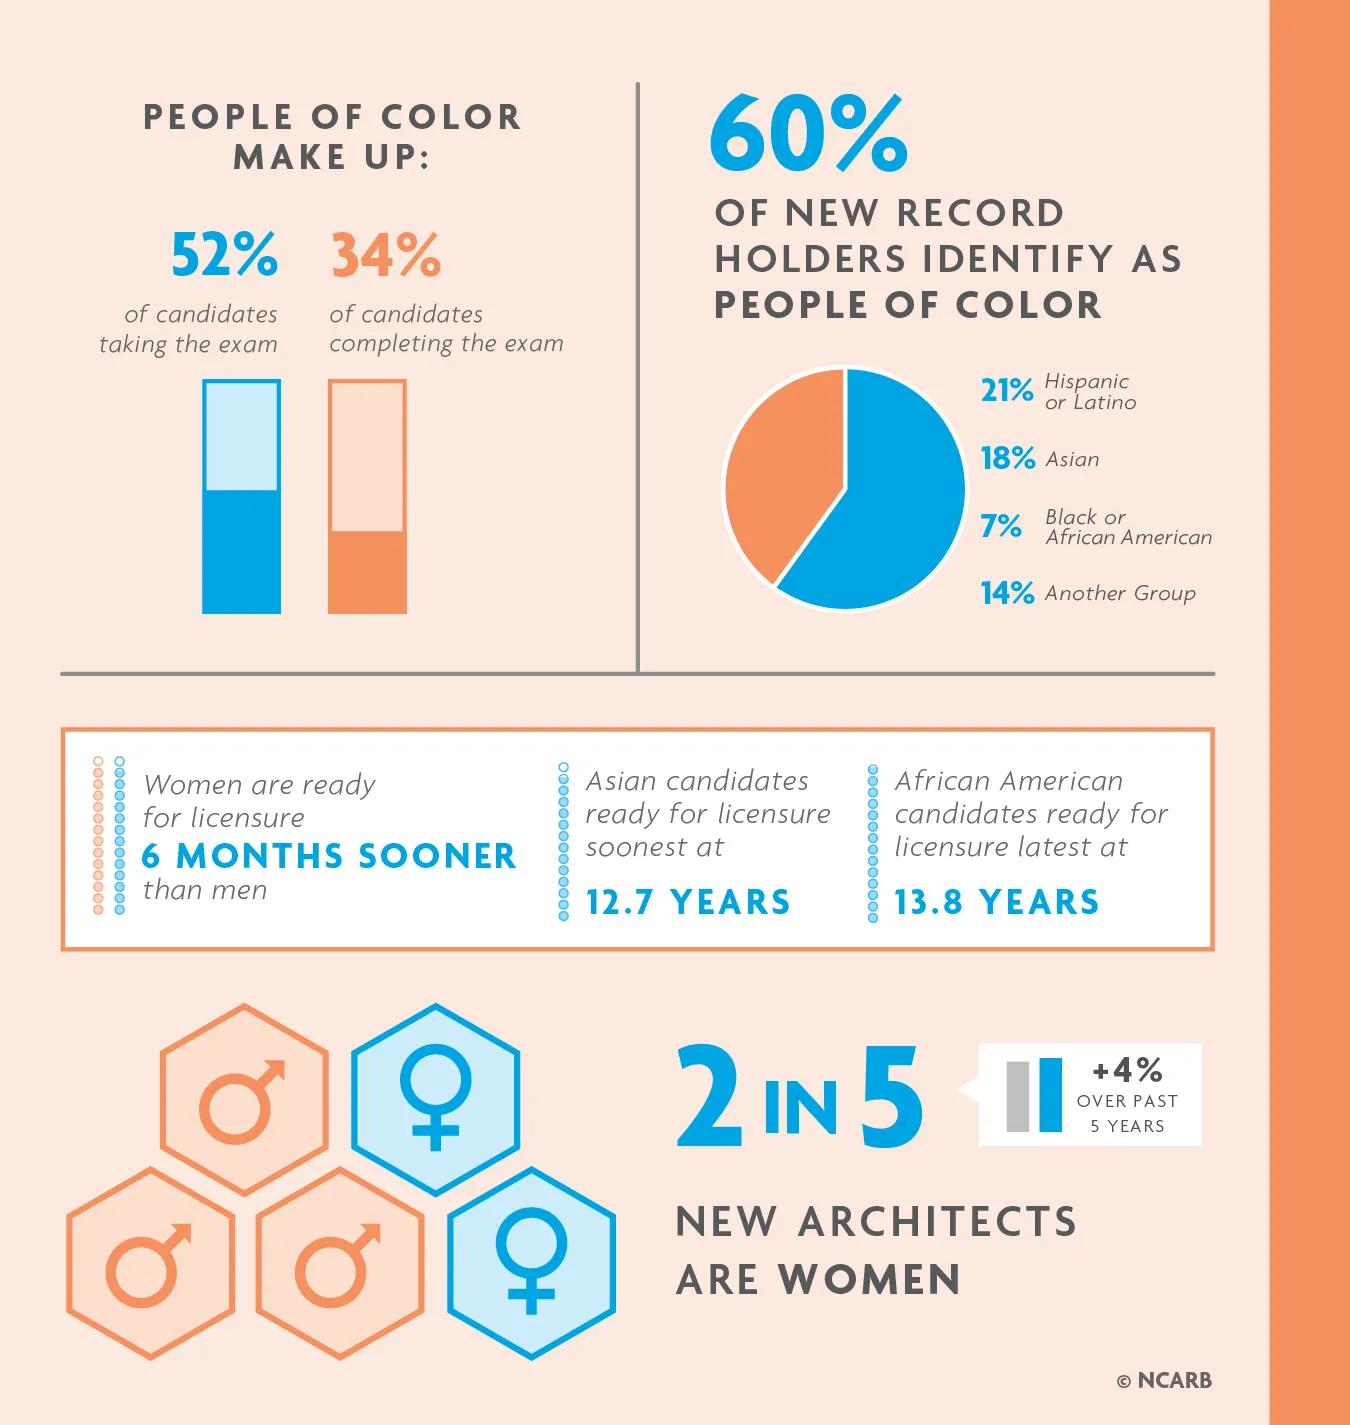
In 2021, 60% of new NCARB Record holders identified as a race or ethnicity other than “white, non-Hispanic or Latino,”roughly 2 percentage points higher than the proportion seen five years ago.
Of new Record holders, 21% identified as Hispanic or Latino, 18% identified as Asian, and 7% identified as Black or African American. Additionally, nearly half (49%) of new Record holders were women, a 5.4% increase compared to 2017.
In 2021, most new Record holders were in the 23-29 age group, although overall, candidates are starting the path to licensure younger than ever. The 18-22 age group grew by 4% compared to 2017, now comprising nearly 30% of all new Record holders.
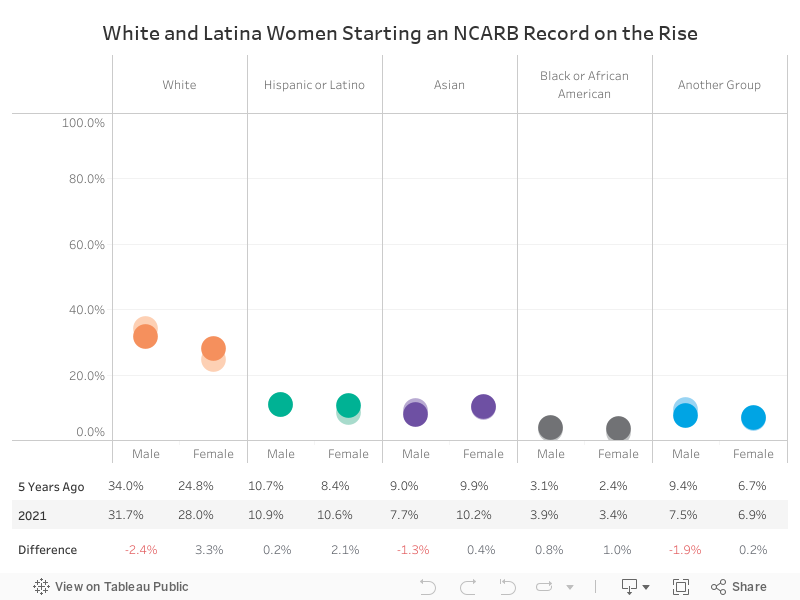
Since 2017, the proportion of women opening an NCARB Record has risen across every race and ethnicity, with white and Latina women seeing the largest increase.
In 2021, white women made up 28% of new Record holders, and Hispanic or Latina women made up nearly 11%—an increase of 3 and 2 percentage points, respectively. Asian, Black or African American, and women of another racial and ethnic group have seen smaller increases.
Meanwhile, the proportion of white men, Hispanic or Latino men, and men of another group have all decreased over the past five years.
Asians are the only race or ethnicity where women are more represented than men. Asian women make up 10% of all new Record holders, while Asian men make up less than 8%.
How to read this chart: Use the drop-down menu at the top of the chart to select the demographic filter you would like to view. The chart will display the individual groups within that filter, with the darker dot for each group showing the 2021 data and the lighter dot showing the 2017 data. The table at the bottom provides exact figures for each group, as well as the percentage point increase or decrease since 2017.
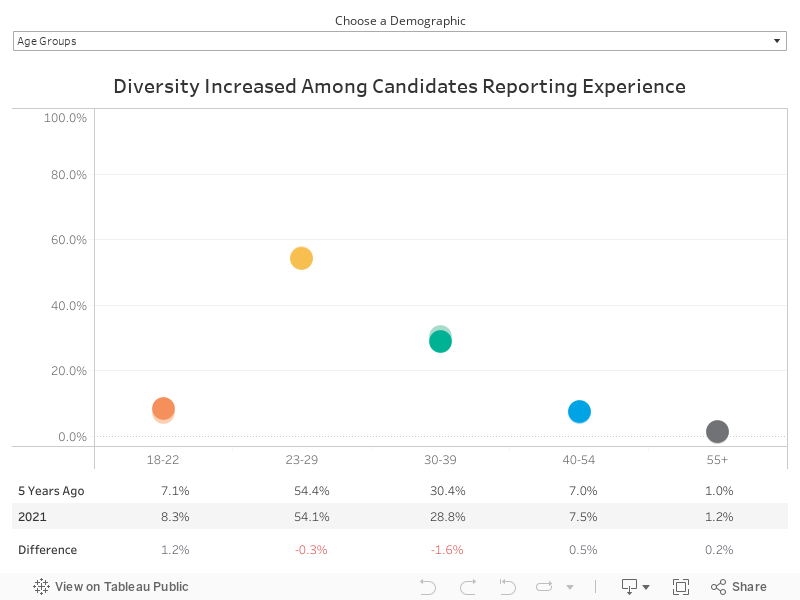
The racial and ethnic diversity seen in the pool of candidates reporting AXP experience has increased by 5 percentage points since 2017, with white candidates making up 55% of all individuals reporting experience in 2021 compared to 60% in 2017. Hispanic or Latino candidates have seen the most growth—they now make up 15% of candidates completing the AXP, a 2 percentage point increase.
Similarly, gender representation in the pool of candidates navigating the experience program has also increased in the past five years, with women now making up 48% of candidates reporting experience.
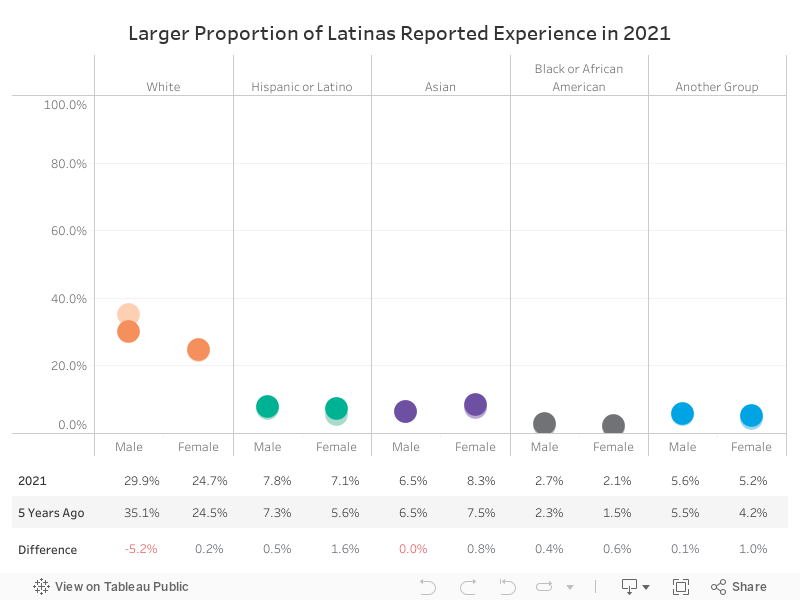
The proportion of Hispanic or Latina women reporting experience rose to 7.1% in 2021, a 1.6% increase in the past five years. This is the largest increase in representation seen for any single group among the pool of candidates working toward completing the AXP.
Women of all racial and ethnic groups saw a slightly larger increase in representation compared to men of the same group, resulting in a 5 percentage point decrease in the proportion of white men.
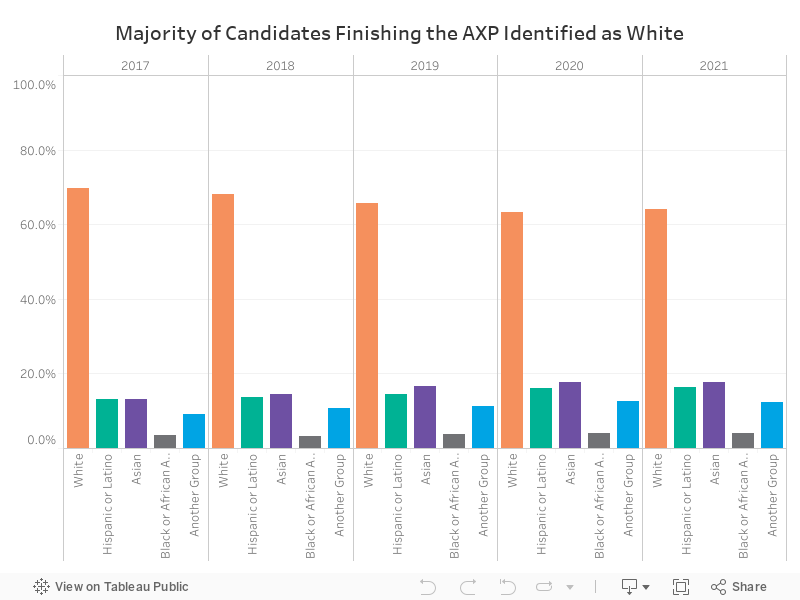
While white individuals made up 55% of candidates reporting experience in 2021, they also made up 64% of candidates completing the AXP in 2021—a 1 percentage point increase compared to 2020.
Asian candidates were the next most represented at 18%. Hispanic or Latino candidates made up 16% of individuals completing the AXP and candidates from another racial or ethnic group making up 12%. Black or African American candidates were the least represented racial and ethnic group, making up 4% of individuals completing the AXP in 2021.
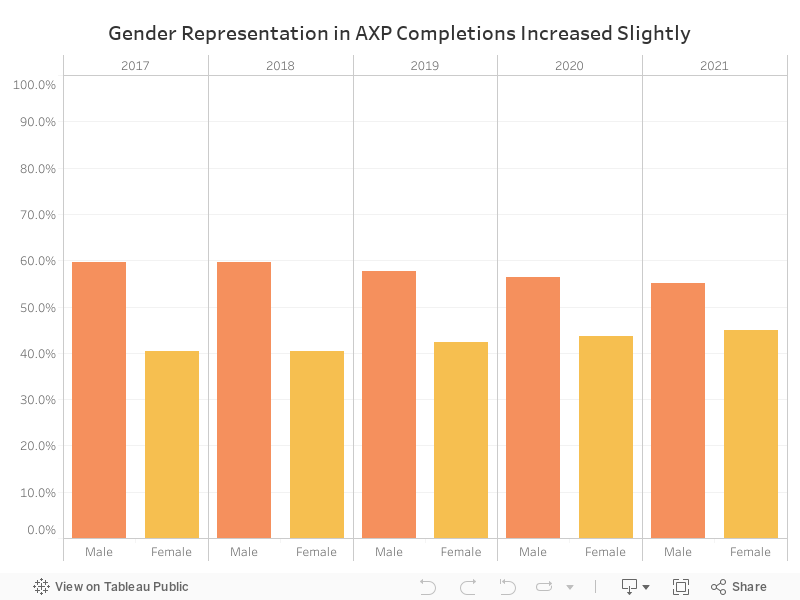
Women made up 45% of the population of candidates who completed the AXP in 2021, a 1 percentage point increase compared to 2020. This is still 3 percentage points fewer than the proportion of women who were working toward completing the experience program in 2021.
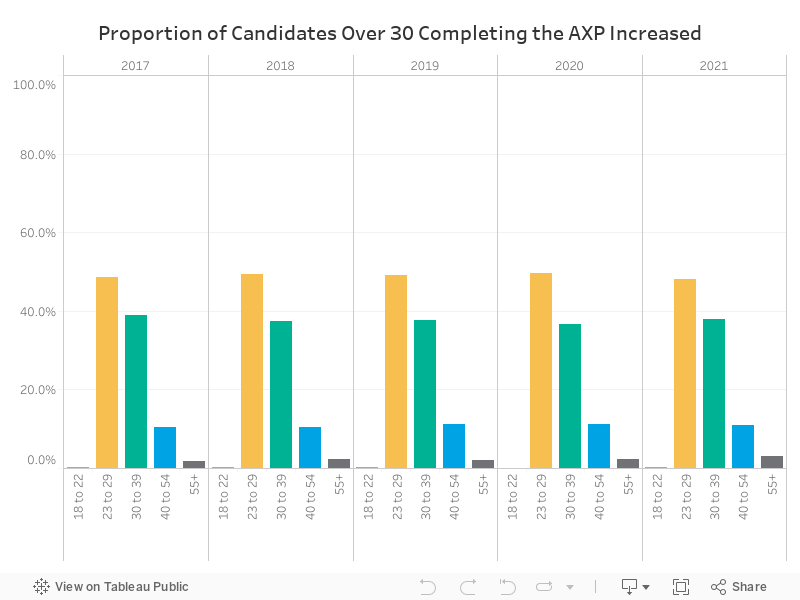
The proportion of individuals completing the AXP in 2021 who were between the ages of 30-39 and 55 or older both rose by 1 percentage point—despite the fact that candidates are now starting the path to licensure younger than ever. The proportion of candidates completing the experience program in 2021 who were between the ages of 23-29 fell by 2 percentage points in 2021.
How to read this chart: Use the drop-down menu at the top of the chart to select the demographic filter you would like to view. The chart will display the individual groups within that filter, with the darker dot for each group showing the 2021 data and the lighter dot showing the 2017 data. The table at the bottom provides exact figures for each group, as well as the percentage point increase or decrease since 2017.
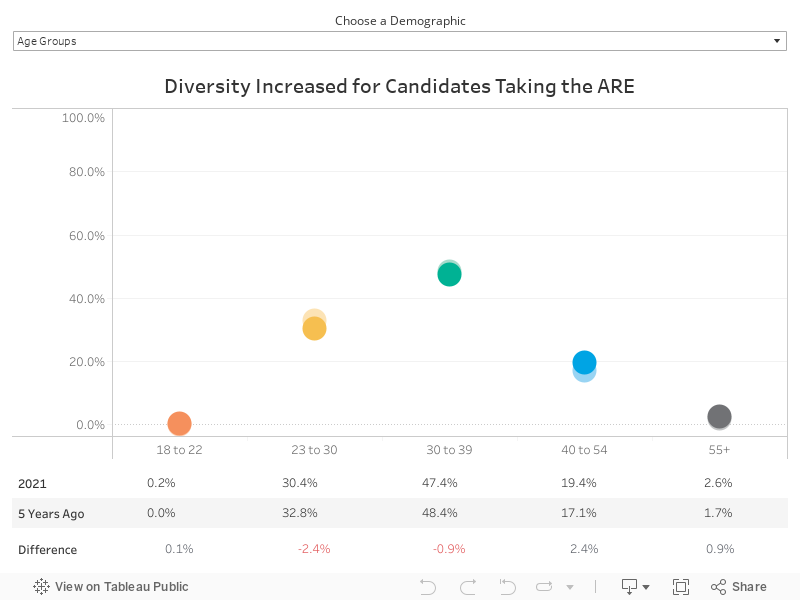
White candidates made up nearly 60% of individuals taking the ARE in 2021. Hispanic or Latino candidates made up 17%, Asians made up 18%, and Black or African Americans made up 6%—increases of 5, 4, and 2 percentage points compared to 2017.
Women made up 47% of candidates taking the exam in 2021, an increase of just under 5 percentage points over the past five years.
Additionally, older candidates were more represented in the pool of individuals taking the ARE, with 40-54-year-olds making up 19% of candidates testing.
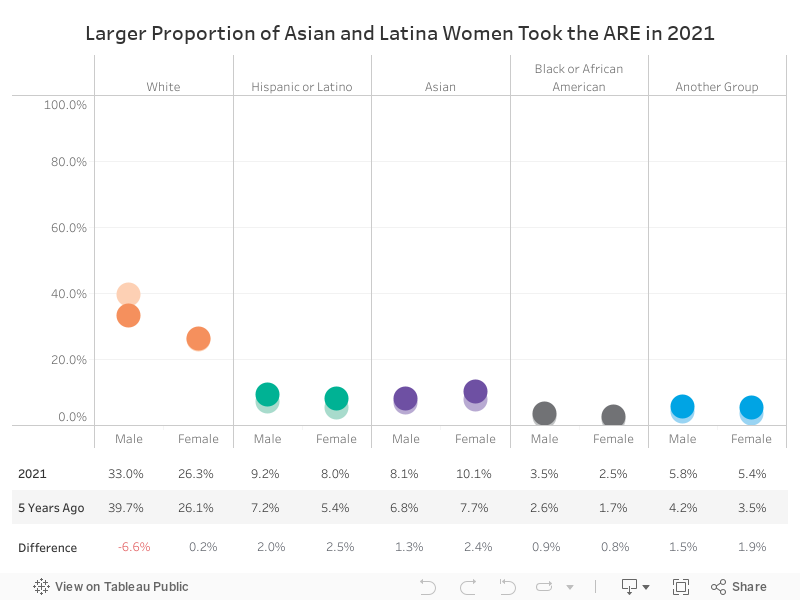
In 2021, white men made up a third of the pool of candidates taking the ARE. At 26%, white women were the next most represented group.
Asian and Hispanic or Latino men and women made up between 8-10% of the candidate pool each, with Asian and Latina women increasing by 2.4 and 2.5 percentage points each—the largest increases seen across all demographic groups.
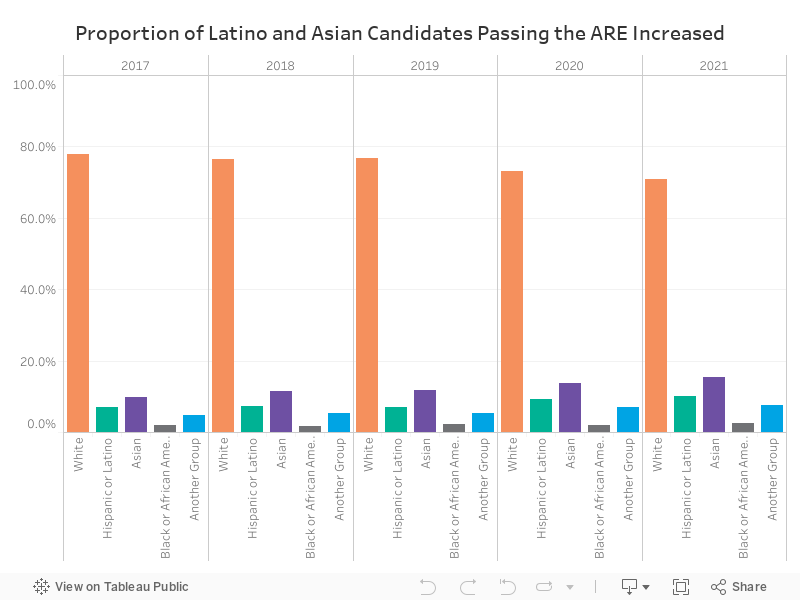
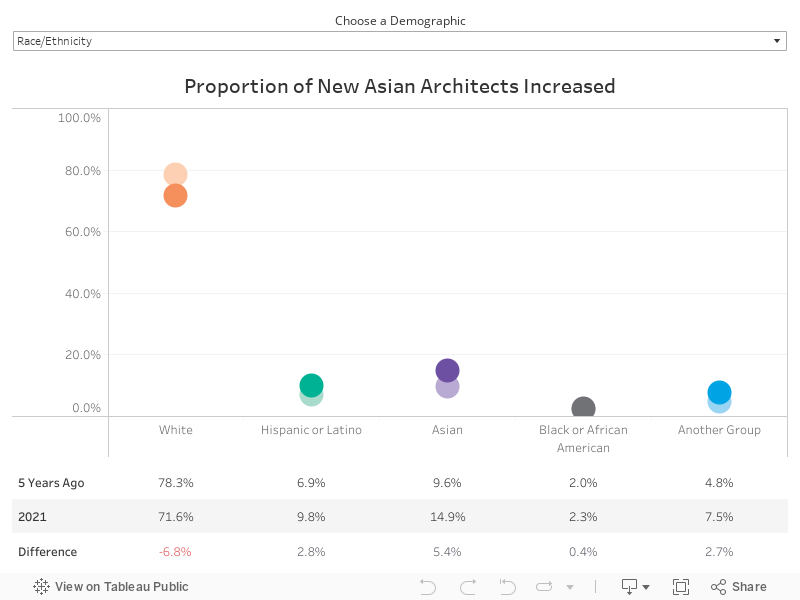
In 2021, 15% of candidates who passed the ARE identified as Asian, and 10% identified as Hispanic or Latino—a 1 percentage point increase for both groups. Meanwhile, the proportion of candidates passing the ARE who identify as Black or African American (2%) has not changed since 2017.
While white candidates made up 59% of candidates taking the ARE in 2021, they represented 71% of candidates passing the ARE.
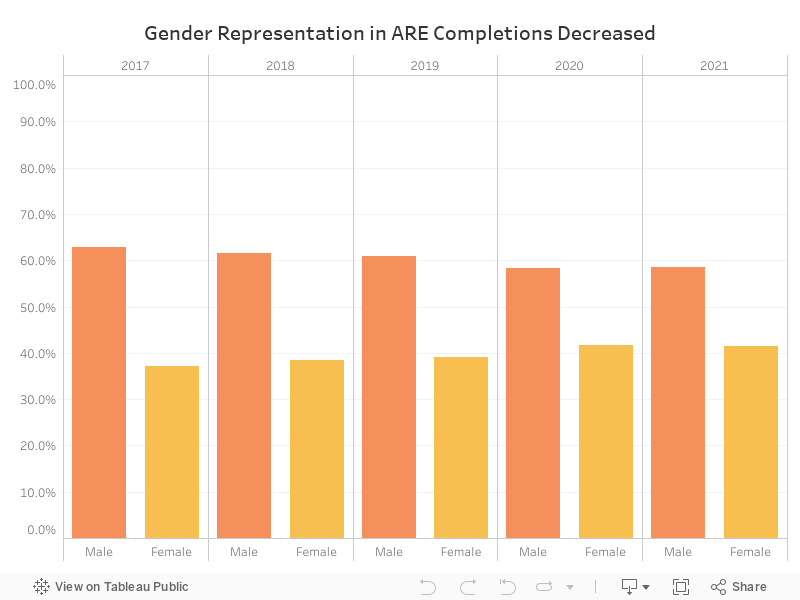
The proportion of candidates completing the ARE who identified as women fell by 1 percent in 2021 to 41%. However, women made up 47% of candidates taking the ARE in 2021—a 6 percentage point gap that is likely due to the higher pass rates seen for white men across the ARE.
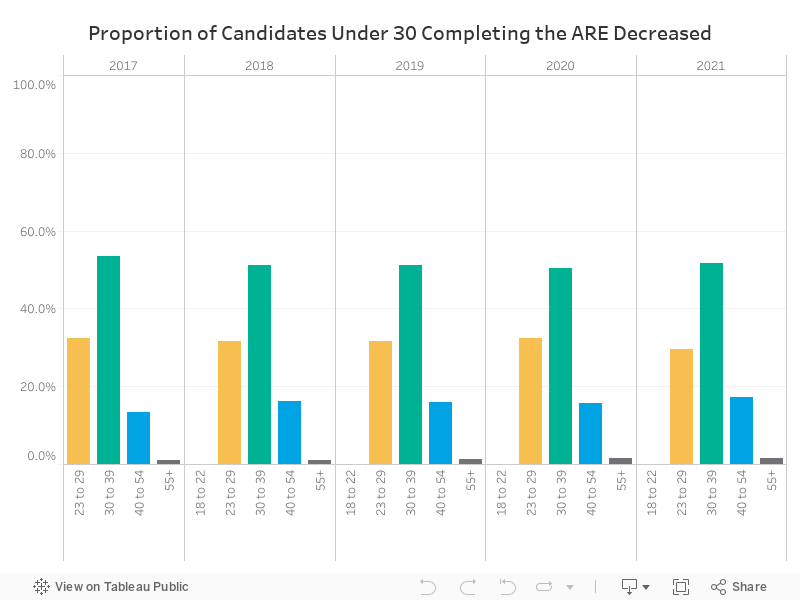
The proportion of candidates who completed the ARE in 2021 and were aged 23-29 at the time fell by 2 percentage points in 2021. The majority of candidates completing the ARE (52%) were between the ages of 30-39, with a 1 percentage point increase also seen for candidates in the 40-54 and 55+ age groups.
How to read this chart: Use the drop-down menu at the top of the chart to select the demographic filter you would like to view. The chart will display the individual groups within that filter, with the darker dot for each group showing the 2021 data and the lighter dot showing the 2017 data. The table at the bottom provides exact figures for each group, as well as the percentage point increase or decrease since 2017.
While white candidates made up 55% of candidates reporting experience and 59% of candidates taking the exam in 2021, they represented a significantly larger proportion of candidates who completed the path to licensure in 2021 (72%).
Asian candidates made up nearly 15% of individuals completing the path to licensure in 2021, a 5.4 percentage point increase compared to 2017. Hispanic or Latino candidates made up nearly 10% of new architects, and individuals who identify as some other race or ethnicity (such as Native American or Pacific Islander) made up 7.5%. Black or African American individuals continue to be the least represented in the population of new architects at 2.3%, an increase of less than half a percentage point compared to 2017.
Women made up more than 40% of new architects in 2021, an increase of 4% compared to 2017. And a larger proportion of the new architect population was 40 or older in 2021, compared to the age distribution of new architects seen five years ago.
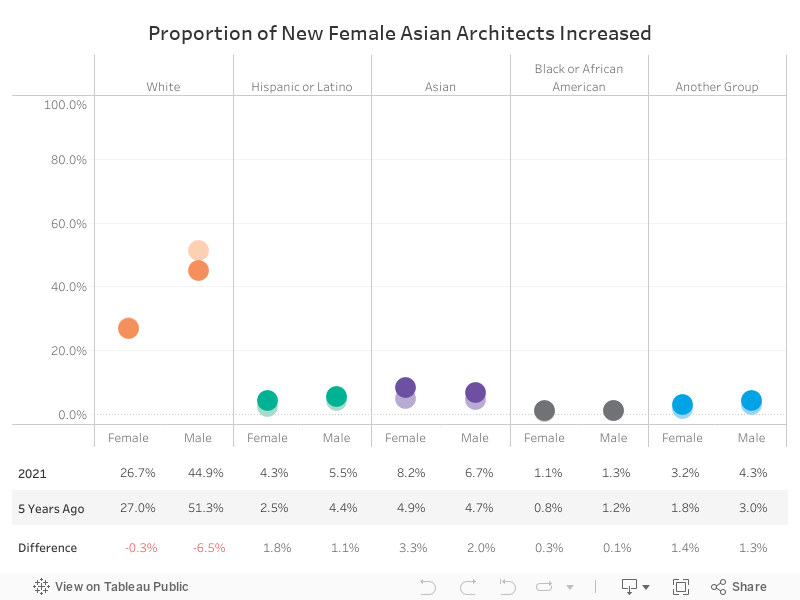
Asian women made up 8.2% of new architects in 2021—an increase of 3.3 percentage points compared to 2017 and the largest representation seen for any group besides white men and women. The proportion of new architects who identify as Asian men rose by 2 percentage points to 6.7%.
By comparison, Black or African American men and women make up roughly the same proportion of new architects as they did five years ago at 1.3% and 1.1%, respectively.
How to read this chart: Use the drop-down menu at the top of the chart to select the demographic filter you would like to view. The chart will display the individual groups within that filter, with the darker dot for each group showing the 2021 data and the lighter dot showing the 2017 data. The table at the bottom provides exact figures for each group, as well as the percentage point increase or decrease since 2017.
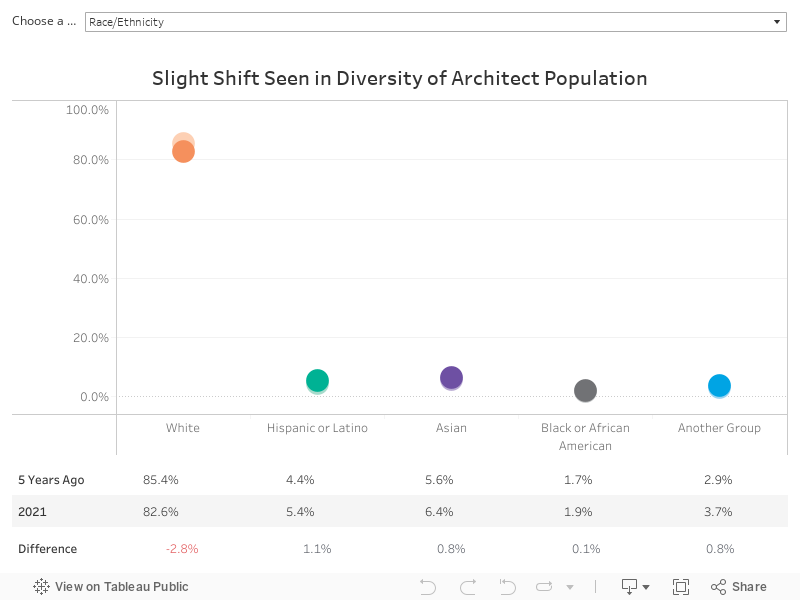
While the diversity of earlier career stages continues to grow, the makeup of the architect population is slower to shift. While white candidates made up 72% of individuals completing the path to licensure, approximately 83% of NCARB Certificate holders identified as white in 2021.
Hispanic or Latino architects made up 5.4% of all NCARB Certificate holders in 2021, a 1.1 percentage point increase compared to 2017. Asian architects made up 6.4% and architects who identified under some other racial and ethnic group made up 3.7%—increases of .8% for both groups. The smallest shift was seen for Black or African American architects, who made up 1.9% of the NCARB Certificate holder population in 2021—just a .1 percentage point increase compared to 2017.
Female architects made up 3.6 percentage points more of the Certificate holder population in 2021 compared to 2017 (now 24.9%). And the proportion of Certificate holders in the 40-54 age group rose by 1.1 percentage points, with the 23-29 and 30-39 age groups both decreasing by less than a percentage point.
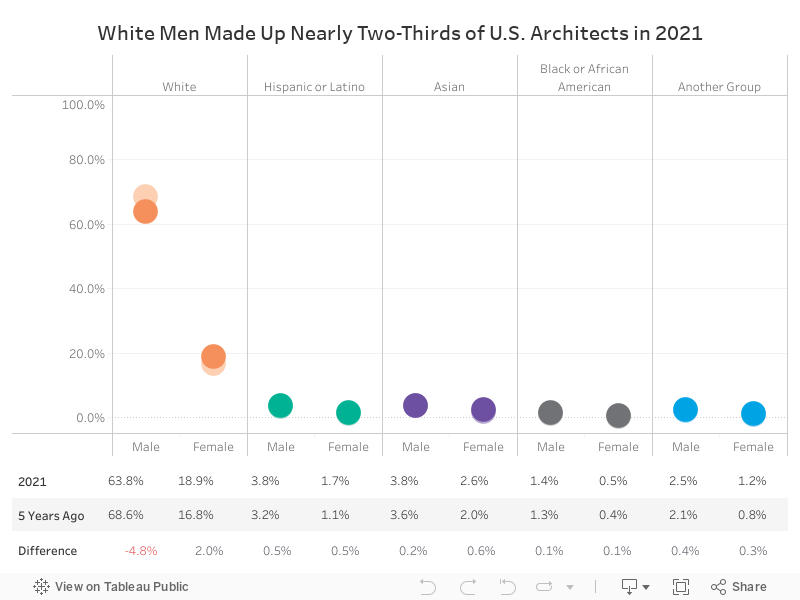
White men made up just under two-thirds (64%) of NCARB Certificate holders in 2021, a decrease of 5 percentage points compared to 2017.
White women are the next most represented group at 19%, with every other racial/ethnic and gender group making up less than 4% of the NCARB Certificate holder population.
At .5% of NCARB Certificate holders, Black or African American women continue to be the least represented demographic group in the architect population—an increase of just .1 percentage points since 2017.
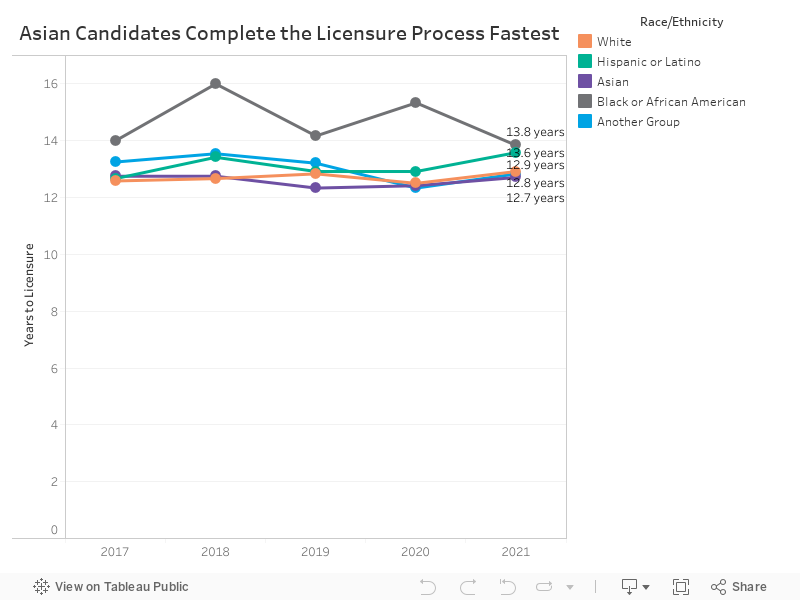
The average Asian candidates who completed the path to licensure in 2021 took 12.8 years, the fastest time seen for any racial or ethnic group. White candidates took an average of one month longer than their Asian peers, while Hispanic or Latino and Black or African American took 10 months and one year longer on average, respectively.
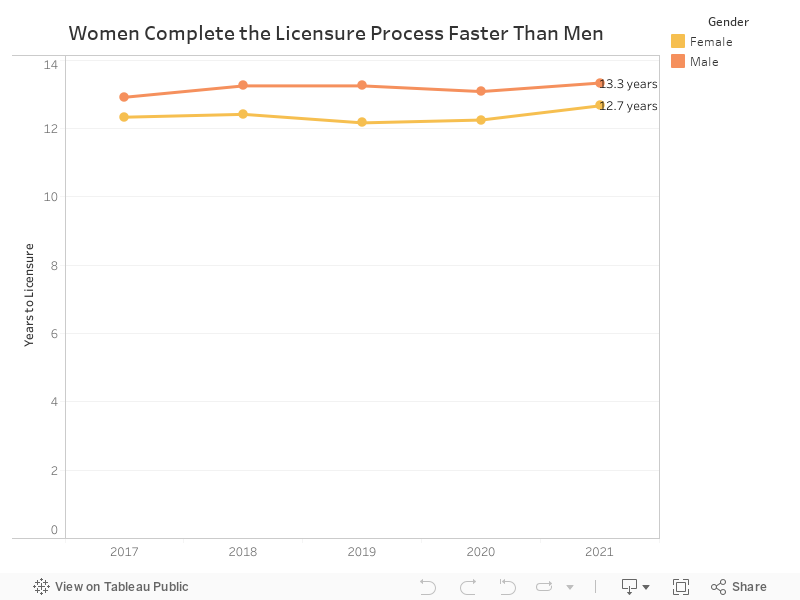
The average woman completing the licensure process in 2021 took 12.7 years—six months faster than the average man who completed the licensure process in 2021. Over the past five years, women have consistently earned their licenses in less time than their male peers.
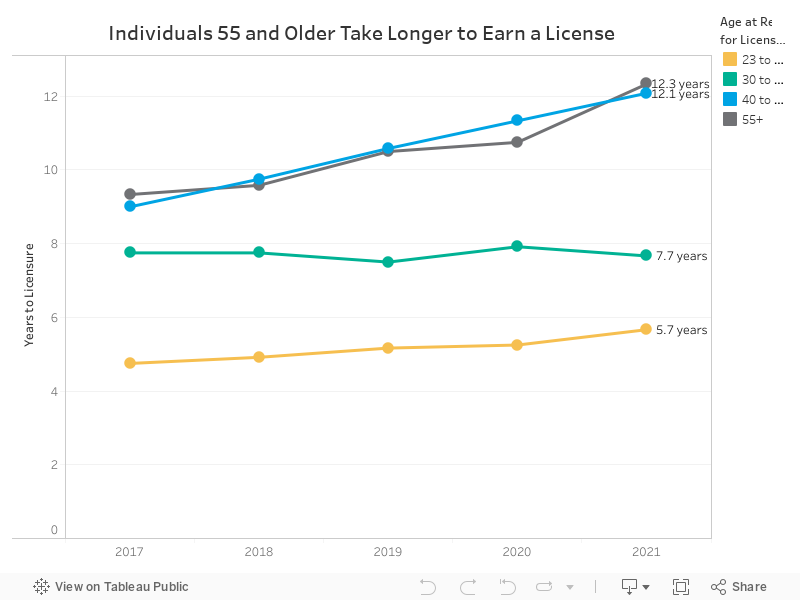
To help provide a clearer picture of the differences in time to licensure by age, NCARB compares the time from the date a candidate started their NCARB Record to the date they completed their final licensure requirement—as opposed to other “time to licensure” charts, which use the date a candidate began their college degree as the start date. This provides a more accurate comparison for older candidates, who may have earned an unrelated degree earlier in their careers.
Candidates in the 18-29 age group completed the licensure process the soonest, taking just 5.7 years on average. This is two years sooner than those in the 30-39 age group, who took an average of 7.7 years.
Candidates aged 40-54 and 55+ took an average of 12.1 and 12.3 years, respectively.
Note: The pool of candidates over 55 years old is very small, which can lead to dramatic fluctuations in time to licensure from year to year.