Required by all 55 U.S. jurisdictions, the Architect Registration Examination® (ARE®) 5.0 is a six-part exam taken by candidates seeking architectural licensure.
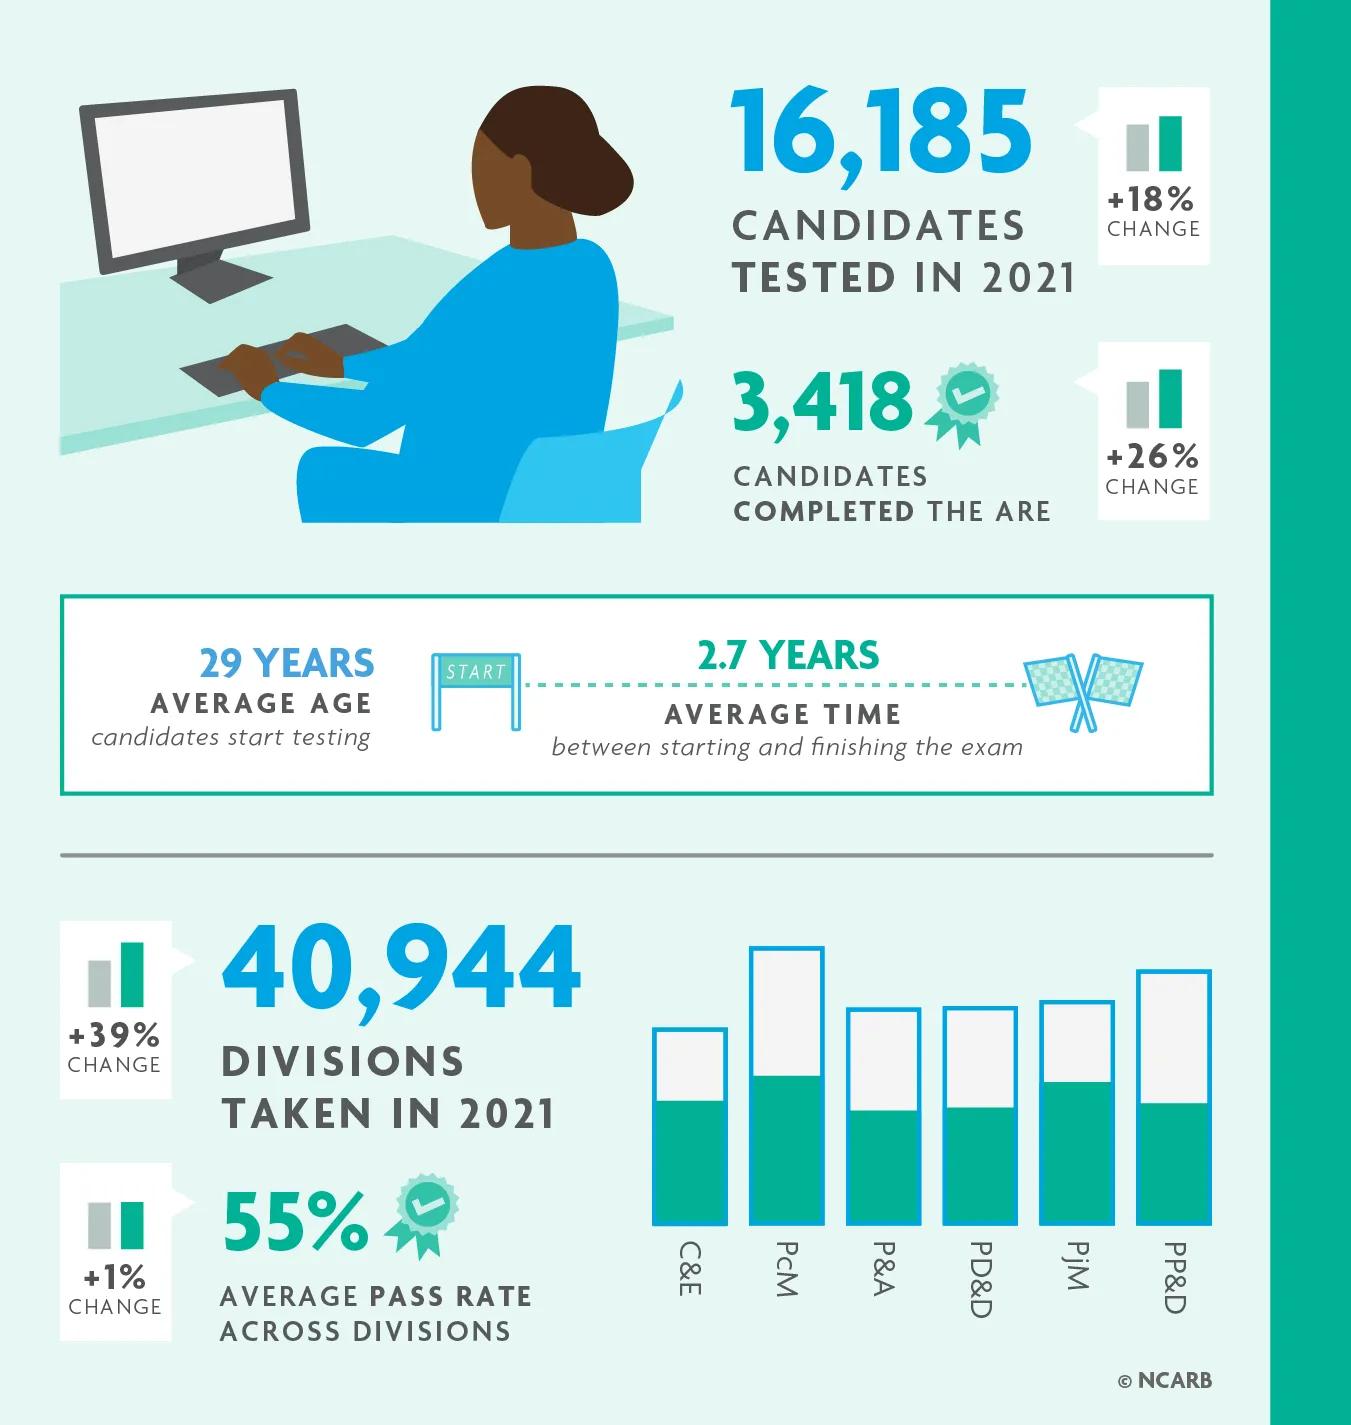
In 2021, the exam candidate pool began to recover from the impact of the COVID-19 pandemic. With 16,185 candidates taking nearly 41,000 exam divisions throughout the year, the ARE saw a return to near-normal levels of exam completions. Just over 3,400 candidates completed the ARE in 2021.
Additionally, 2021 pass rates revealed the impact of several important changes to the exam that were launched in December 2020: a reduction in the number of questions per division that allowed candidates more time per question, along with other formatting changes. As a result, the overall ARE 5.0 pass rate across all six divisions rose to a new high of 55%.
However, not all demographics saw an improvement in pass rates in 2021. While pass rates for Asian and Latino candidates rose in 2021, white men continue have the highest pass rates compared to other demographic groups. NCARB is exploring a variety of factors that could be impacting ARE pass rates, such as AXP progress, exam question types, and more.
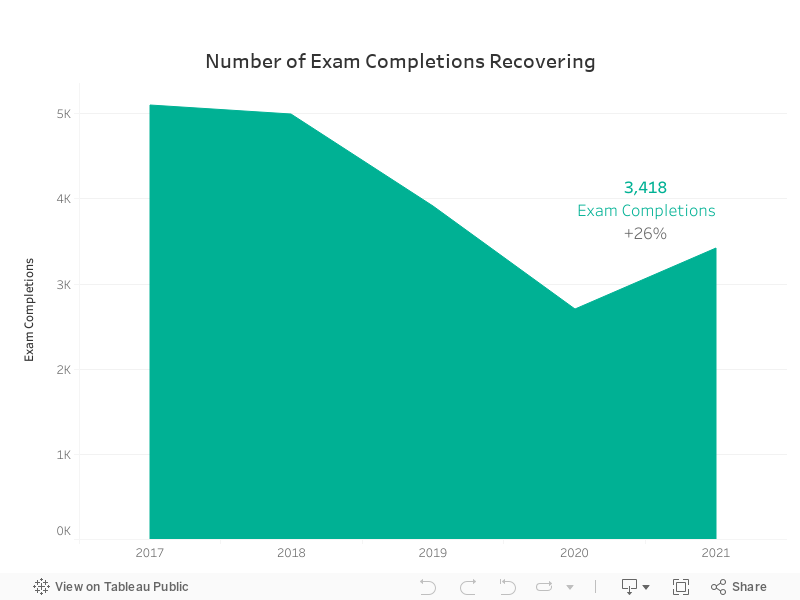
The number of candidates completing the national licensing exam rose from 2,703 in 2020 to 3,418 in 2021. This 26% increase brought the number of ARE completions much closer to pre-pandemic levels (nearly 4,000 candidates completed the exam in 2019).
The dip in exam completions seen in 2020 was a result of test center closures during the early months of the COVID-19 pandemic, as well as limited testing availability throughout the remainder of the year. With the launch of online proctoring in December 2020, and increased availability of in-person testing, candidates were able to make near-normal levels of ARE progress in 2021.
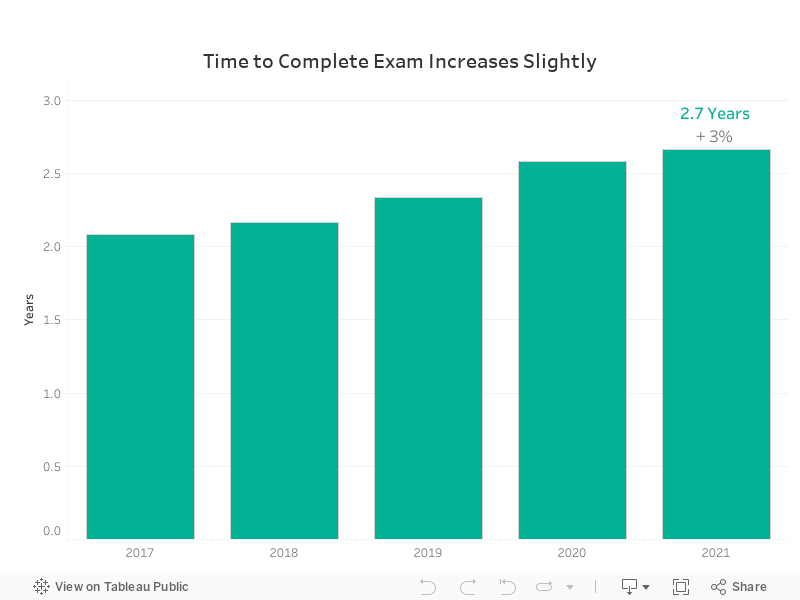
The average candidate who completed the ARE in 2021 took 2.7 years—approximately one month longer compared to 2020. This slight increase is likely a result of 2020’s test center closures and the ongoing impact of the COVID-19 pandemic, which led many candidates to delay their testing plans.
It is likely that the pandemic will continue to be reflected in program completion time over the next several years, as candidates continue to recover from both direct and indirect impacts on their licensure journeys.
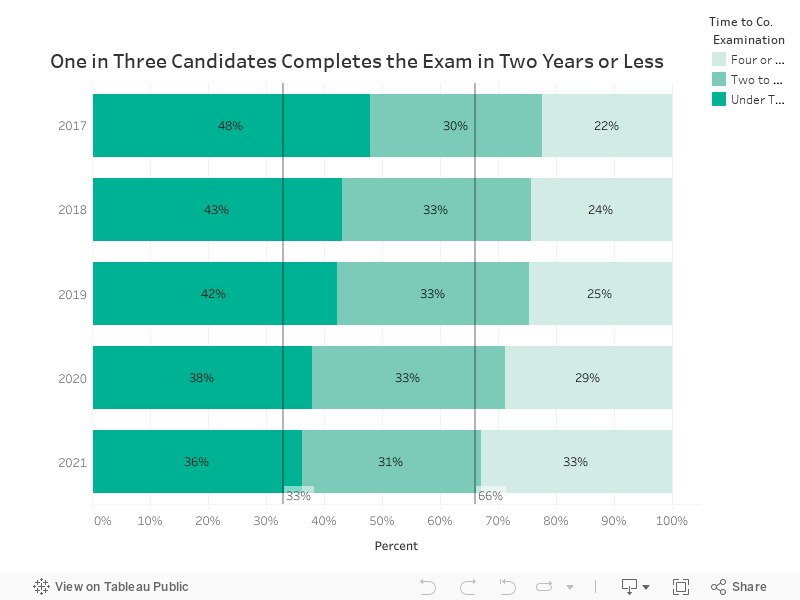
Just over a third (36%) of ARE candidates who finished the exam in 2021 did so in two years or less. The proportion of candidates who complete the exam in under two years has been steadily declining since 2017, when nearly half (48%) were able to complete the exam in two years or less.
The higher historical proportion of candidates completing the exam in a shorter time frame was likely due to the transition from ARE 4.0 to 5.0. The transition prompted many candidates to speed up their testing time frame and enabled many candidates to complete the exam in as few as five divisions through strategic testing.
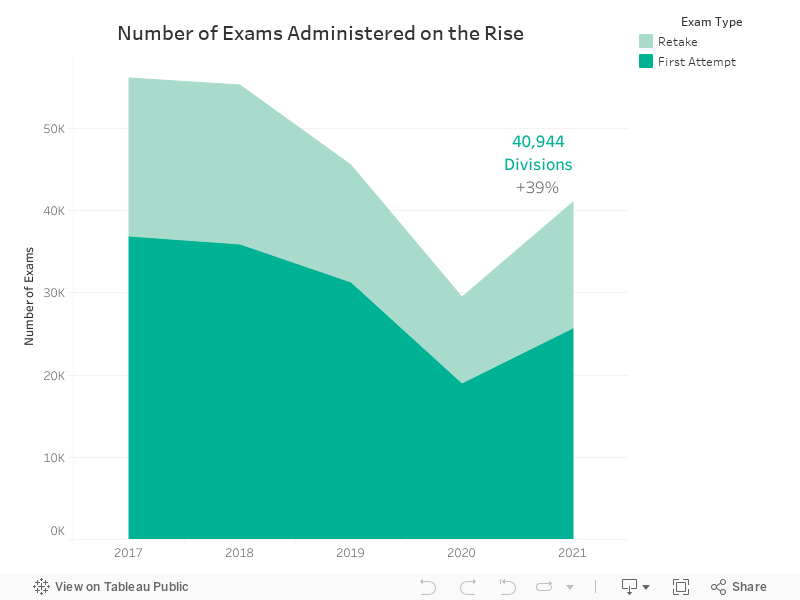
The number of exams administered rose from 29,390 in 2020 to 40,944 in 2021—an increase of 39%. This is just 4,600 fewer exams than the pre-pandemic number seen in 2019.
Of the exams administered in 2021, just over a third (15,230) were retakes, and the remaining 25,714 were first attempts. A similar ratio of first attempts to retakes has been seen throughout ARE 5.0’s history.
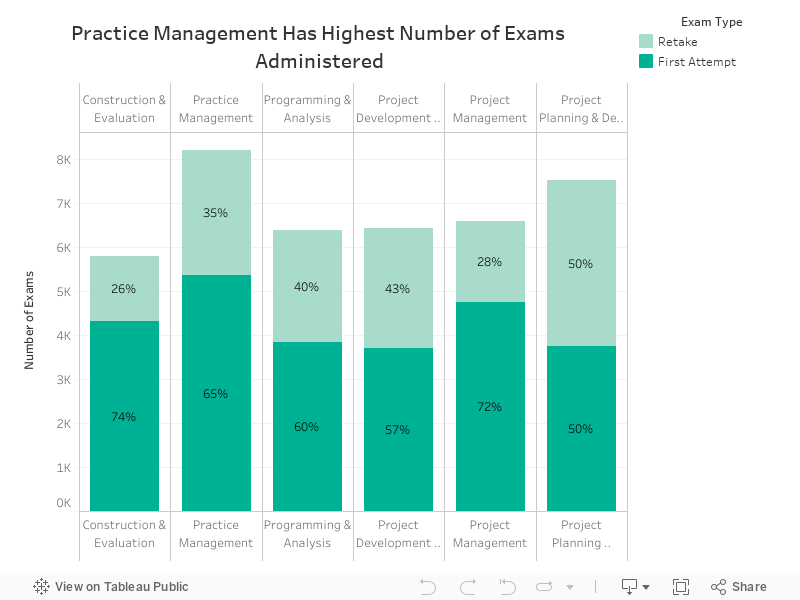
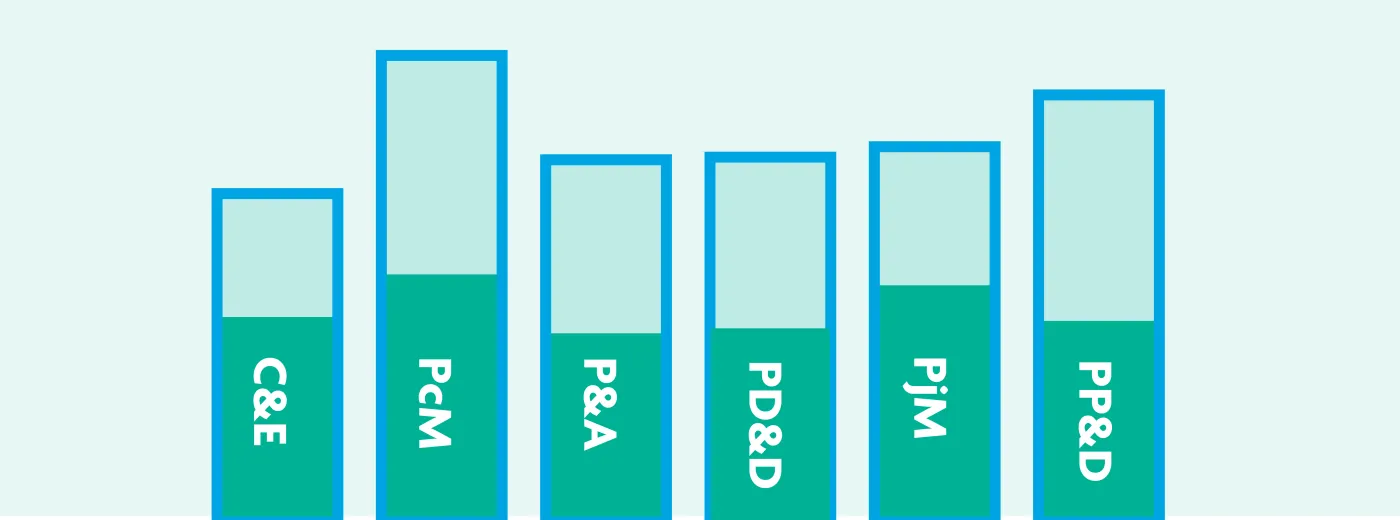
Of the nearly 41,000 exams taken in 2021, over 8,000 of them (20%) were for the Practice Management division, including 5,370 first attempts and 2,835 retakes. Meanwhile, Project Planning & Design saw the largest proportion of retakes—less than half of the PPD divisions administered in 2021 were first attempts.
Construction & Evaluation and Project Management saw the lowest proportion of retakes—a reflection of the higher initial pass rates seen for these divisions.
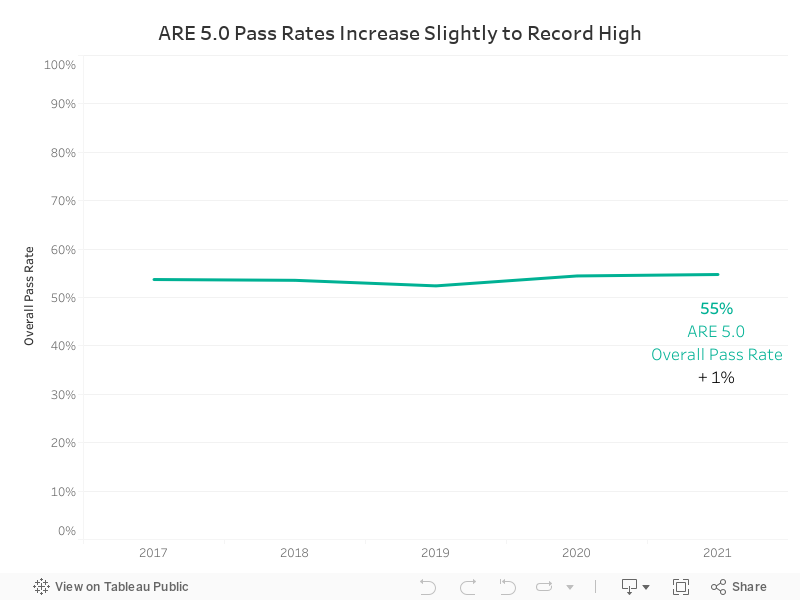
The average pass rate across all ARE 5.0 divisions rose slightly to 55% in 2021—the highest overall pass rate seen since ARE 5.0 launched in November 2016.
This improvement was likely driven by changes to the exam format that launched mid-December 2020, providing candidates with more time per question.
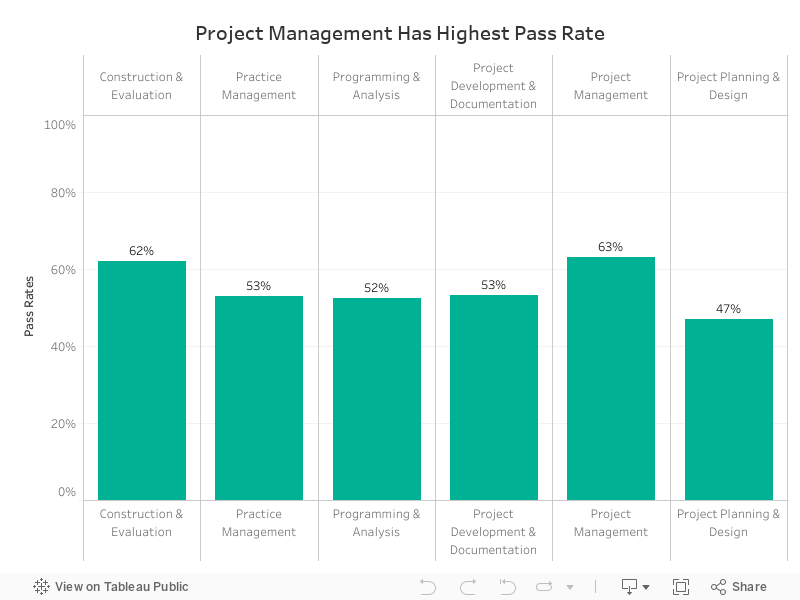
For the first time since ARE 5.0’s launch in 2016, Construction & Evaluation (CE) did not have the highest pass rate in 2021. Out of the exam’s six divisions, Project Management (PjM) had the highest pass rate at 63% (no change compared to 2020).
Project Planning & Design (PPD) continued to have the lowest pass rate at 47%—however, the division did see an increase of 2% compared to its pass rate in 2020.
Programming & Analysis (PA) and Practice Management (PcM) also saw a 2% increase in pass rates in 2021, while CE and Project Development & Documentation (PDD) both fell by 4%.
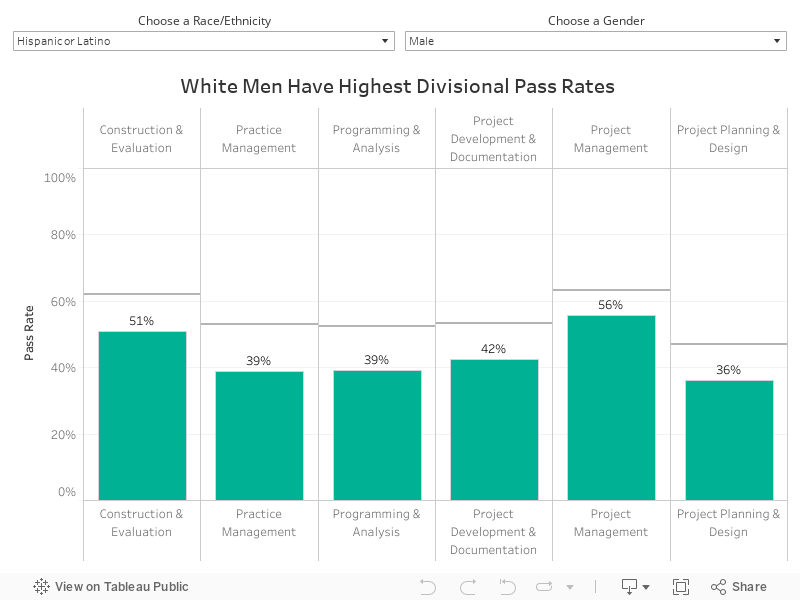
How to use this chart: By selecting demographic characteristics from the top right menus, you can filter the chart to view only pass rates for the selected gender/race/ethnicity. For example, to view pass rates for Black or African American women, select “Female” from the gender menu and “Black or African American” from the race/ethnicity menu.
White men had the highest pass rate on every ARE 5.0 division in 2021, often by significant margins when compared to their peers of other races, ethnicities, and genders (with one exception: white men and women were equally as likely to pass Practice Management). The average pass rate of white men on each ARE division exceeded the national average by a range of 6-16 percentage points, depending on the division.
For the most part, women achieved lower pass rates compared to men of the same race or ethnicity—although not always across all divisions. When viewed solely by gender, male candidates outperformed female candidates on all ARE divisions except Practice Management, where men and women saw equal pass rates.
On average, Black or African American women saw pass rates 19-44 percentage points lower than their white male peers—the largest gap between demographic groups. The smallest difference in pass rates was on the Practice Management division; the largest difference was on the Programming & Analysis division.
NCARB is working to better understand the source of demographic disparities on the ARE. NCARB is exploring how factors such as question type, content area, language, readability, and overall progress along the path to licensure may impact candidate performance.
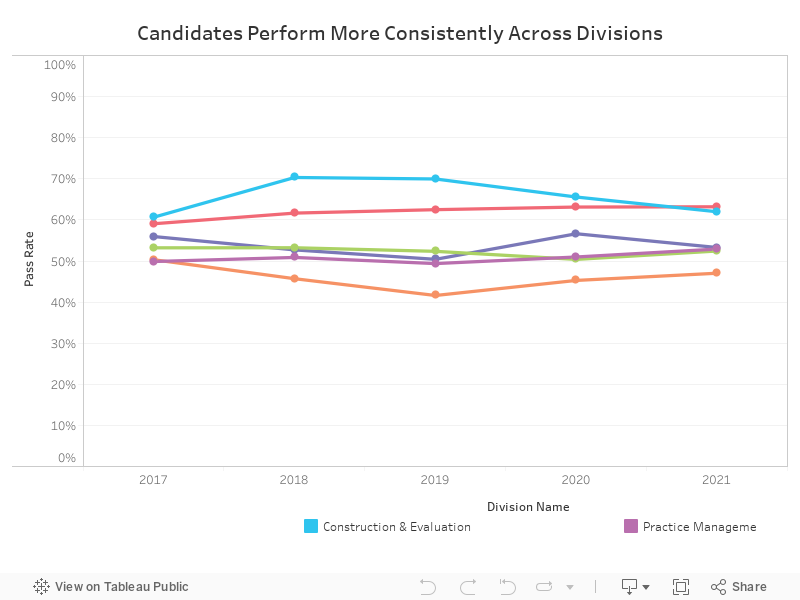
A big-picture review of divisional pass rates over time shows that candidate performance across all six divisions continued moving toward a more consistent pass rate. The spread between the division with the highest pass rate (PjM) and the division with the lowest pass rate (PPD) was 16 percentage points in 2021, compared to the 28 percentage point spread seen in 2019.
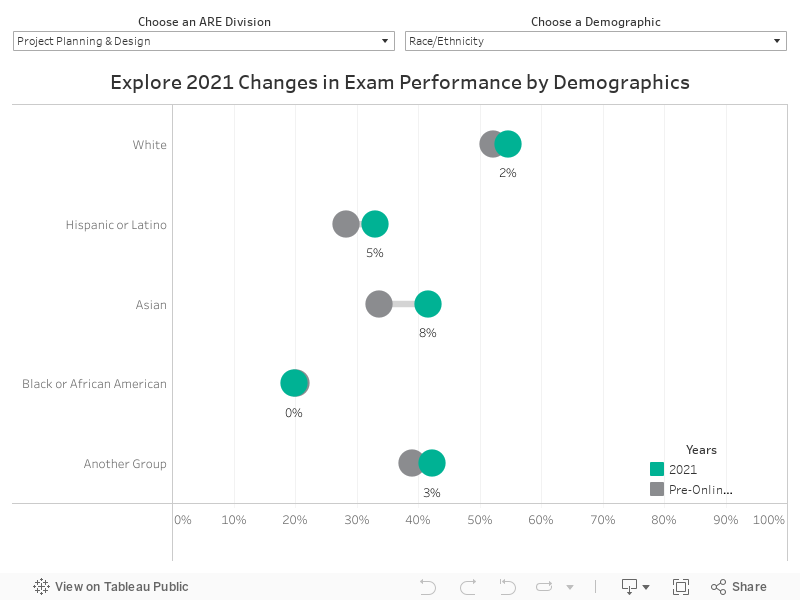
How to use this chart: By selecting a division and a demographic filter, you can see how pass rates shifted in 2021 for candidates of a specific group on a specific exam. For example, selecting “Project Management” and “Gender” will allow you to see whether pass rates for men and women rose or fell on that division during 2021.
In 2021, average pass rates for several divisions (PA, PcM, and PPD) rose, while pass rates for others (CE, PDD, PjM) either fell or stayed the same. However, demographic groups experienced those pass rate shifts differently.
Black or African American candidates typically saw the least positive change in pass rates compared to their peers of other demographics. For example, Asian candidates saw an 8 percentage point increase in Practice Management pass rates, but Black or African American candidates only saw a 2 percentage point increase in pass rates on PcM.
Viewing the divisional pass rate shifts by gender shows that men and women typically saw the same or similar changes in pass rates, with the exception of CE, where women saw an 8 percentage point decrease compared to 4 percentage points for men.
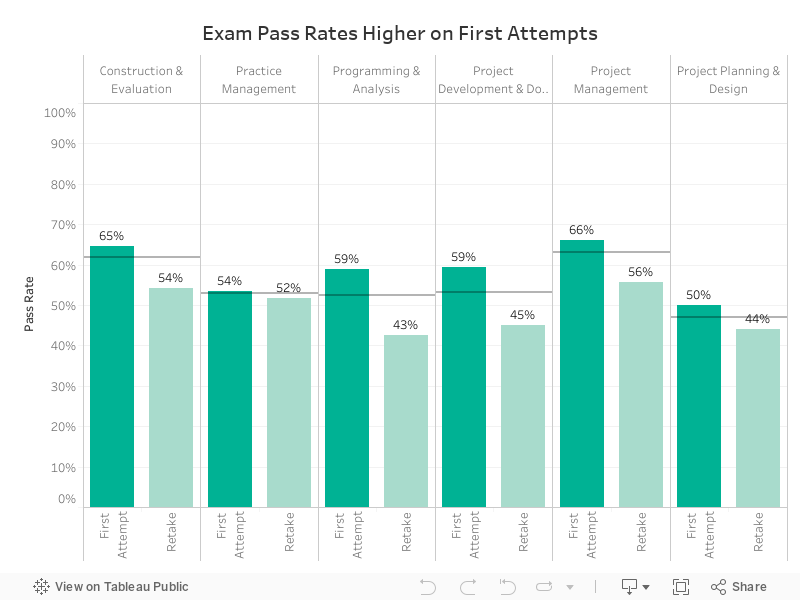
For each ARE 5.0 division, pass rates for first attempts were higher than pass rates for all subsequent retakes on that same division. Programming & Analysis had the largest gap between first attempts (59%) and retakes (43%)—a 16 percentage point difference.
Practice Management had the smallest gap between first attempts (54%) and retakes (52%)—a 2 percentage point difference.
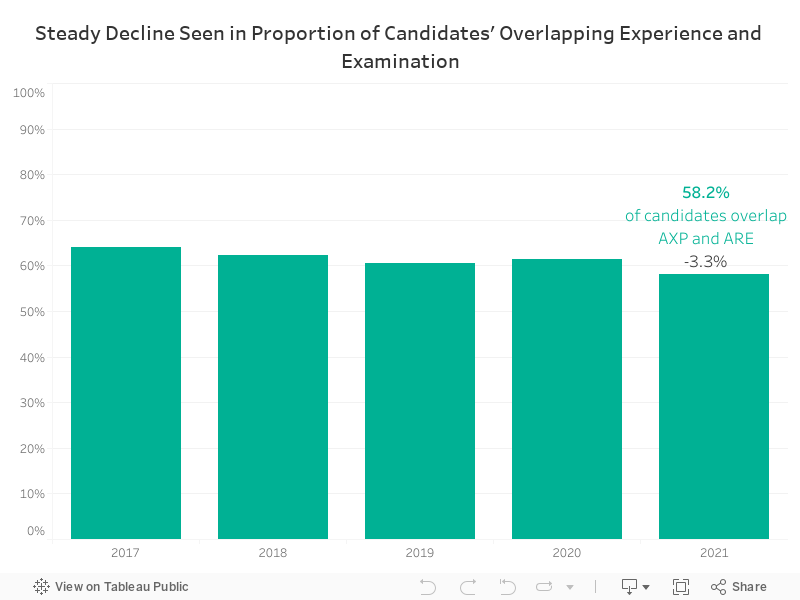
Of the candidates who completed the ARE in 2021, 58% took at least one division prior to completing the experience program—3 percentage points fewer than in 2020. The proportion of candidates overlapping the AXP and ARE has been steadily declining since ARE 5.0’s launch in 2016, which aligned the AXP’s practice areas with the exam’s divisions.
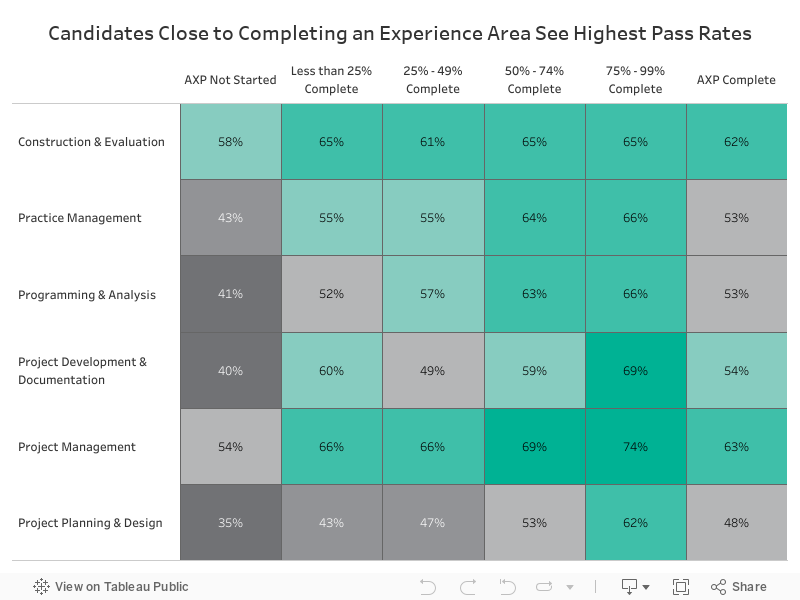
The six experience areas of the AXP align with the six divisions of ARE 5.0. On average, candidates who completed 75-99% of a given experience area before taking the related exam division saw the highest pass rates.
For example, candidates who completed 75-99% of the Project Management experience area before taking the PjM exam saw a pass rate of 74%. However, candidates who hadn’t yet started the PjM experience area before taking the PjM exam saw a pass rate of 54%.
Note: The majority of candidates complete some or all of an experience area before testing.
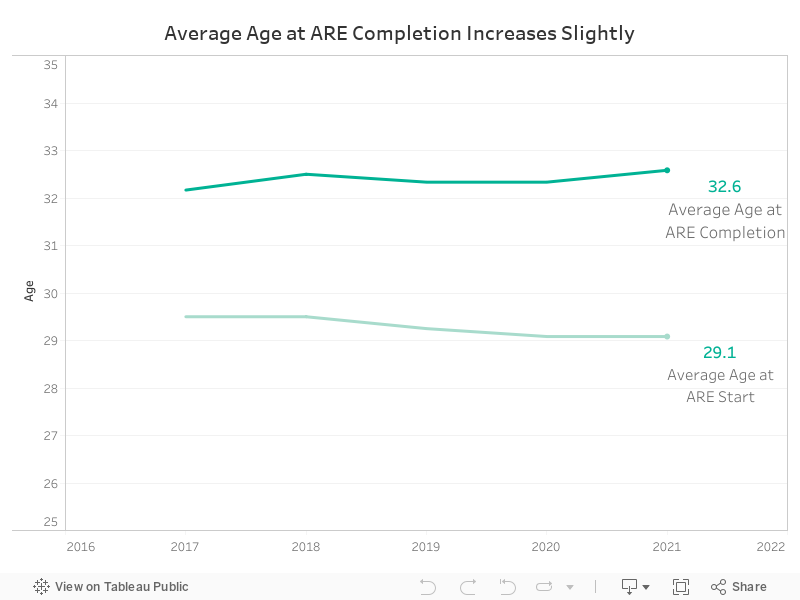
The average candidate who completed the ARE in 2021 was 32.6 years old—approximately 4 months older than the average candidate completing the exam in 2020.
The average age of candidates who began the ARE in 2021 remained the same as in 2020: 29 years old.