
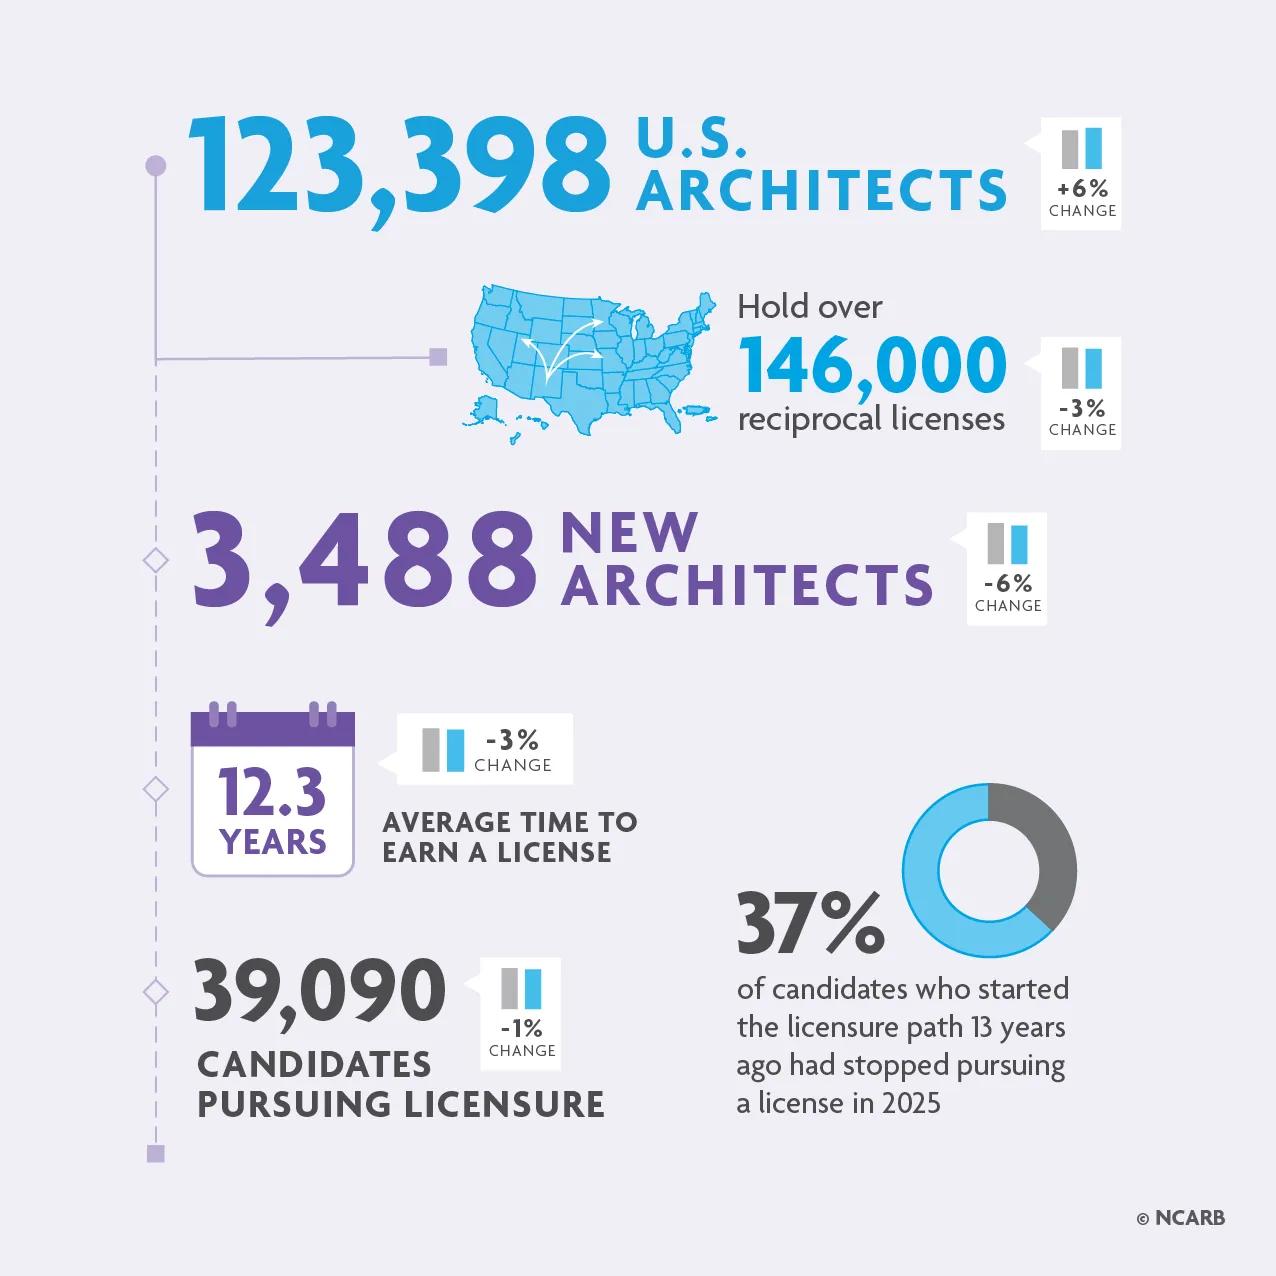
The number of licensed architects grew in 2025—but the pool of candidates pursuing licensure fell slightly. Despite the 1% decrease in candidates working toward licensure, NCARB has still seen high levels of active candidates over the past several years. Meanwhile, the total number of U.S. architects recovered from last year’s drop and the number of reciprocal licenses dipped slightly, in keeping with the pattern NCARB has seen historically in license distribution.
The number of newly licensed architects dropped by 6% (just over 200 individuals), but still aligned with the typical 9 – 10% of the active candidate pool. Those new architects completed the path to licensure faster than the previous year: On average, it took candidates 12.3 years to earn a license in 2025, approximately 4 months less than in 2024.
Recently, NCARB has implemented several programmatic changes that could impact the state of licensure—including the retirement of the licensing exam’s 5-year expiration date on passed divisions and adjusting the experience program’s reporting policy to allow credit for experience older than 5 years. These changes have led to current decreases in the average time to earn a license but could result in longer licensure timelines in the future.
Typically, 36 – 38% of candidates stop pursuing licensure over the average licensure period (12 – 13 years). As NCARB reduces unnecessary impediments and improves accessibility on the path to licensure, we hope to see these changes reflected in attrition rates and licensure statistics in the years to come.
The number of U.S. architects rose by 6%.
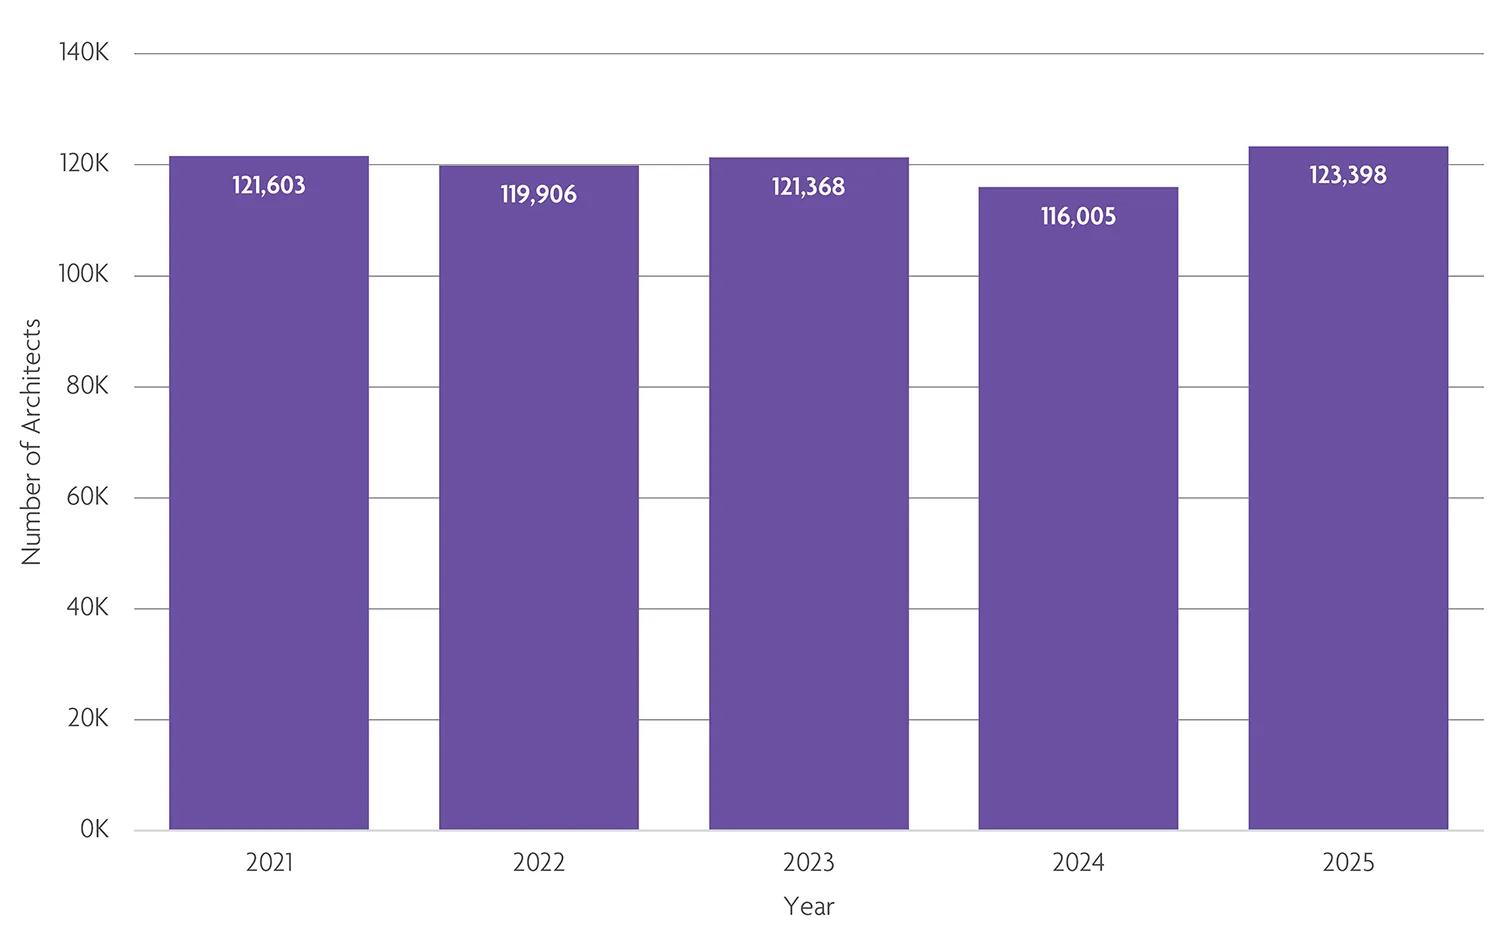
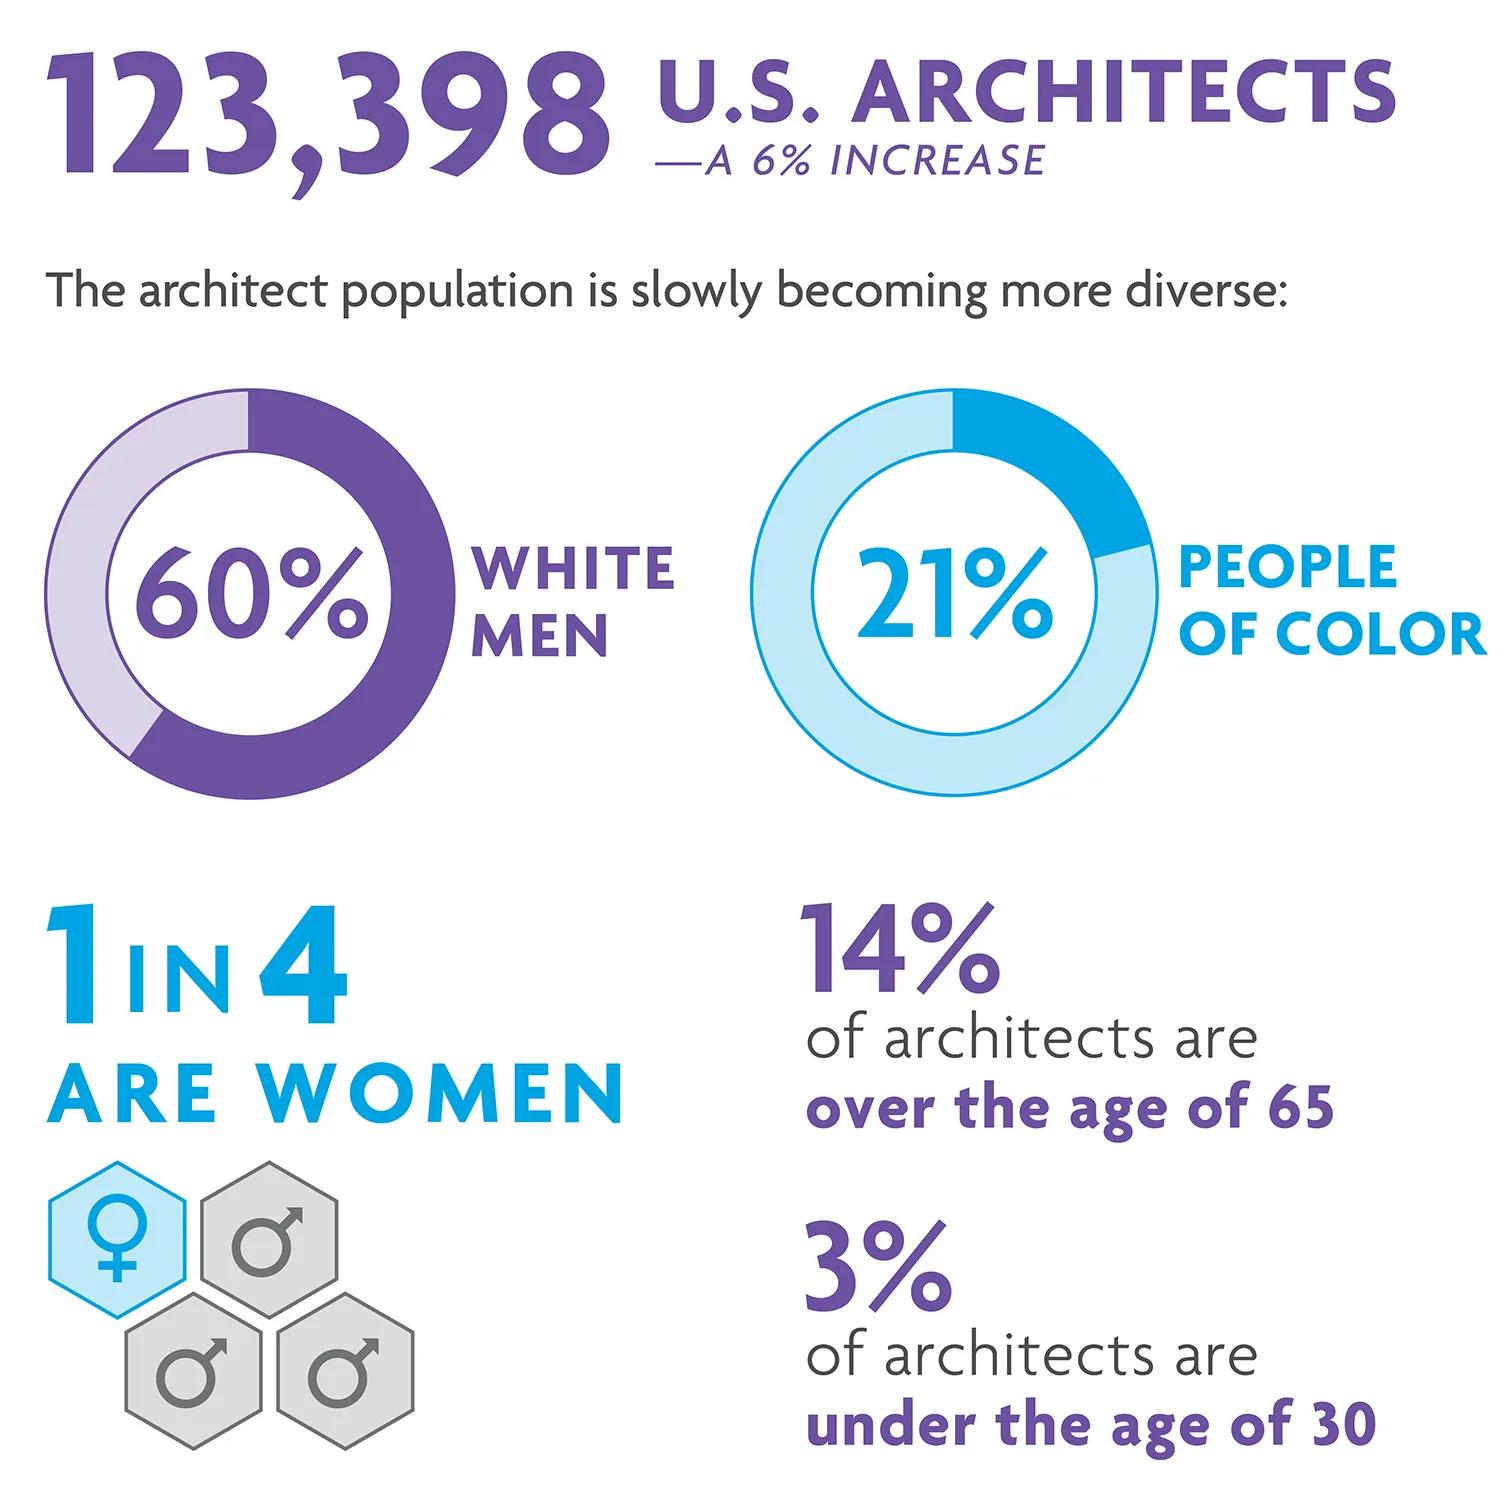
The number of U.S. architects rose by 6% in 2025, according to NCARB’s annual Survey of Architectural Registration Boards. This recovery from last year’s decline could be the result of changes in the way state licensing boards report residential versus reciprocal licenses; in addition, individuals who became inactive in 2024 may have returned to renew their license in 2025. However, NCARB continues to anticipate a decline in the number of U.S. architects in the coming years as baby boomers begin to filter out of the pool of architects. Architects who are over the age of 65 made up 14% of the total architect pool in 2025. As the oldest baby boomers begin to reach their 80s, the number of architects might fall over the next several years before evening out at a “new normal.”
DID YOU KNOW? Traditionally, many older architects have held on to a single license long past their “official” retirement.
The number of reciprocal licenses fell by 3%.
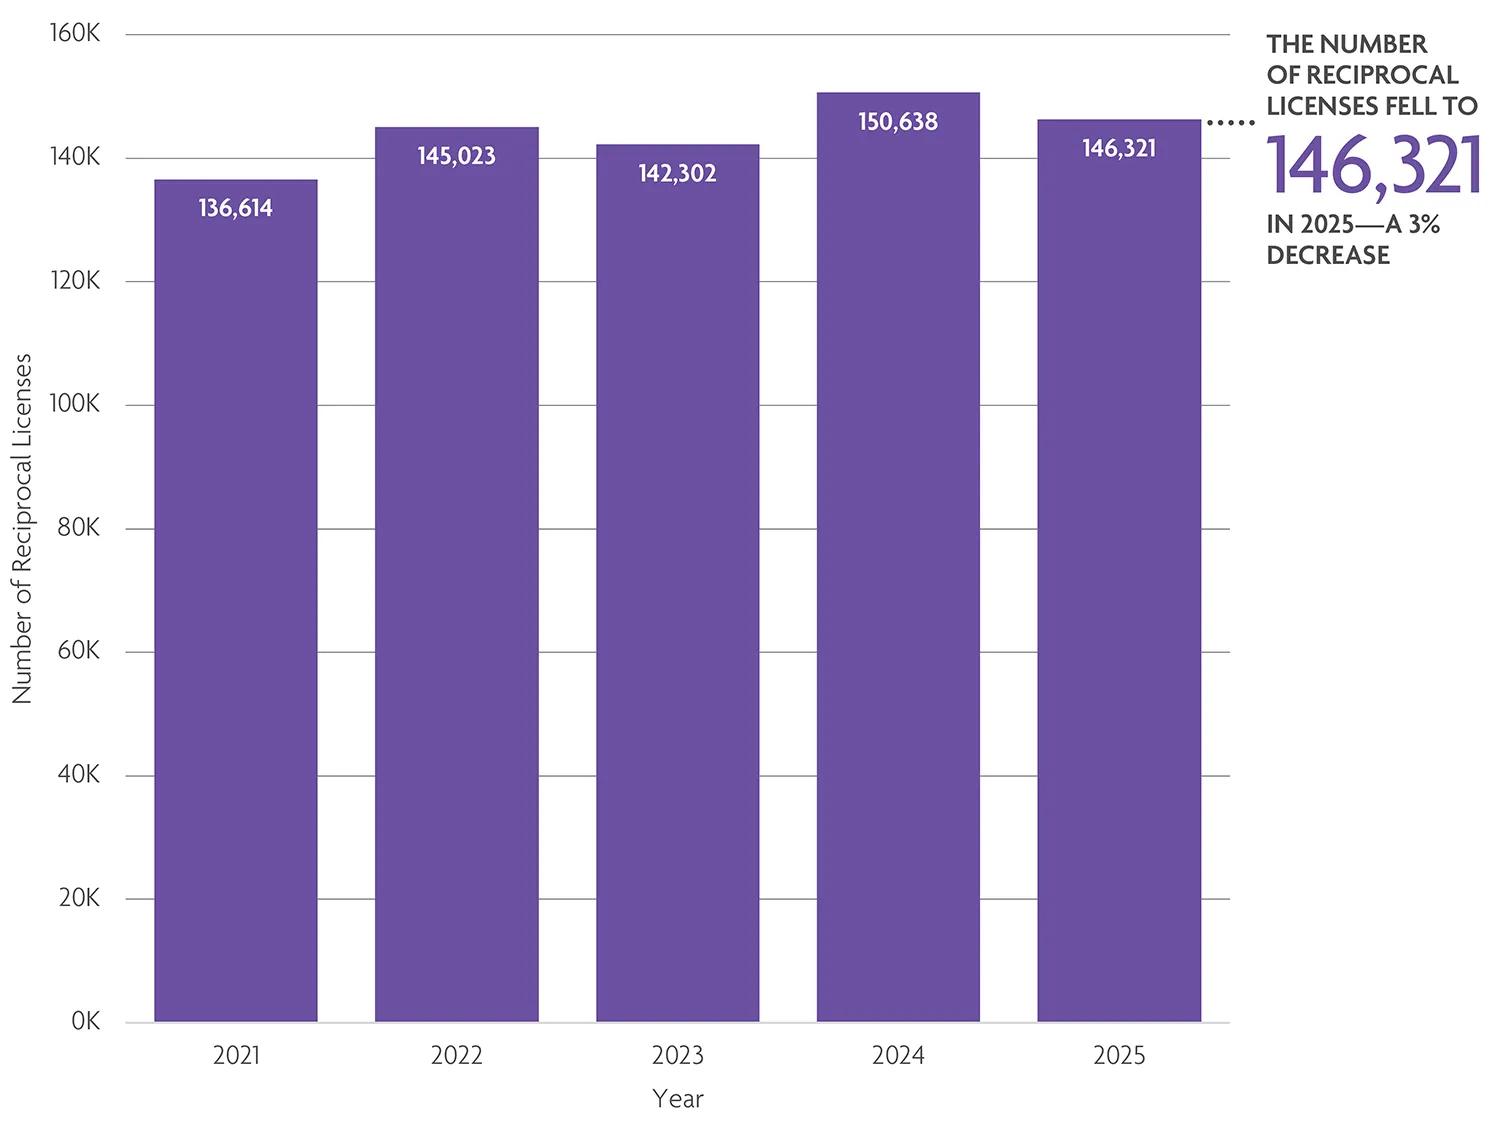
Many architects are licensed in more than one state, which allows them to meet existing clients’ needs and expand their potential client base. In 2025, the number of out-of-state (or reciprocal) licenses fell to 146,321, according to NCARB’s annual Survey of Architectural Registration Boards. While the overall number of reciprocal licenses has generally been trending upward, NCARB has historically seen a pattern of alternating increases and decreases from year to year. In this context, 2025’s decline is likely a part of this pattern as architects respond to ebbs and flows in client demand.
The number of architects per capita increased in 2025.
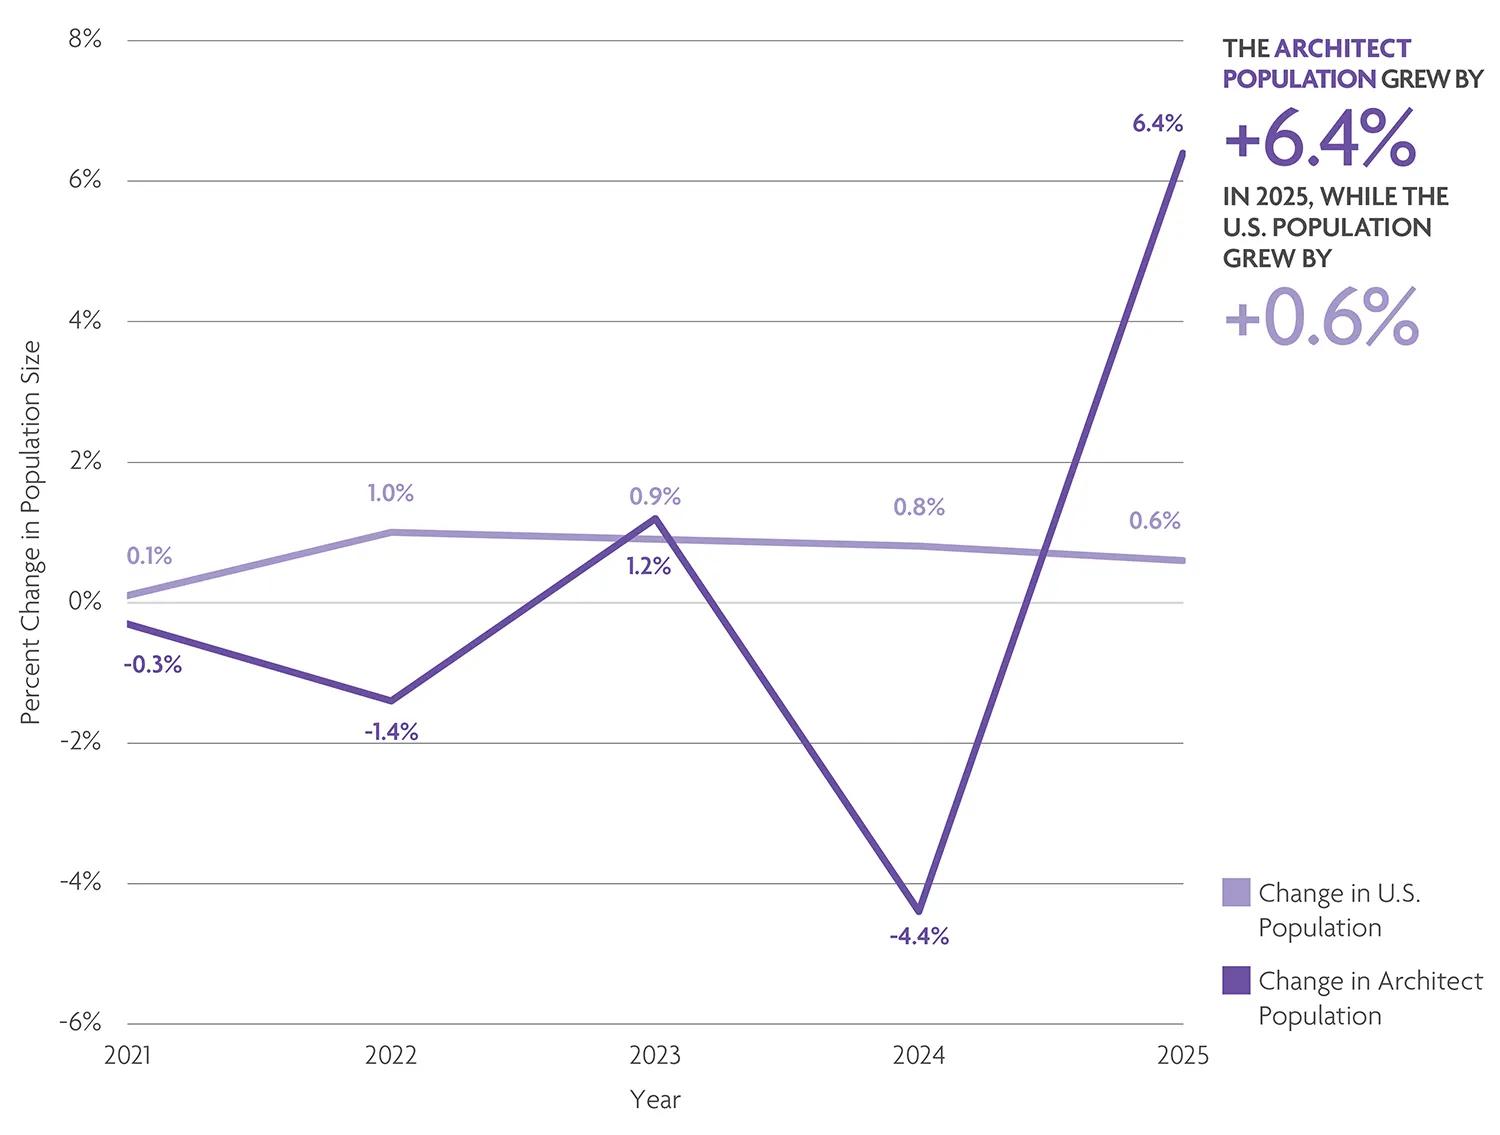
While the number of architects licensed in the United States has risen 6% since 2024, the total U.S. population has risen just 0.6%, according to data from the U.S. Census Bureau. There are now slightly more architects per capita (roughly 1 architect to every 2,940 people) than there were in 2024 (roughly 1 architect to every 2,779 people).
The number of active licensure candidates fell by 1%.
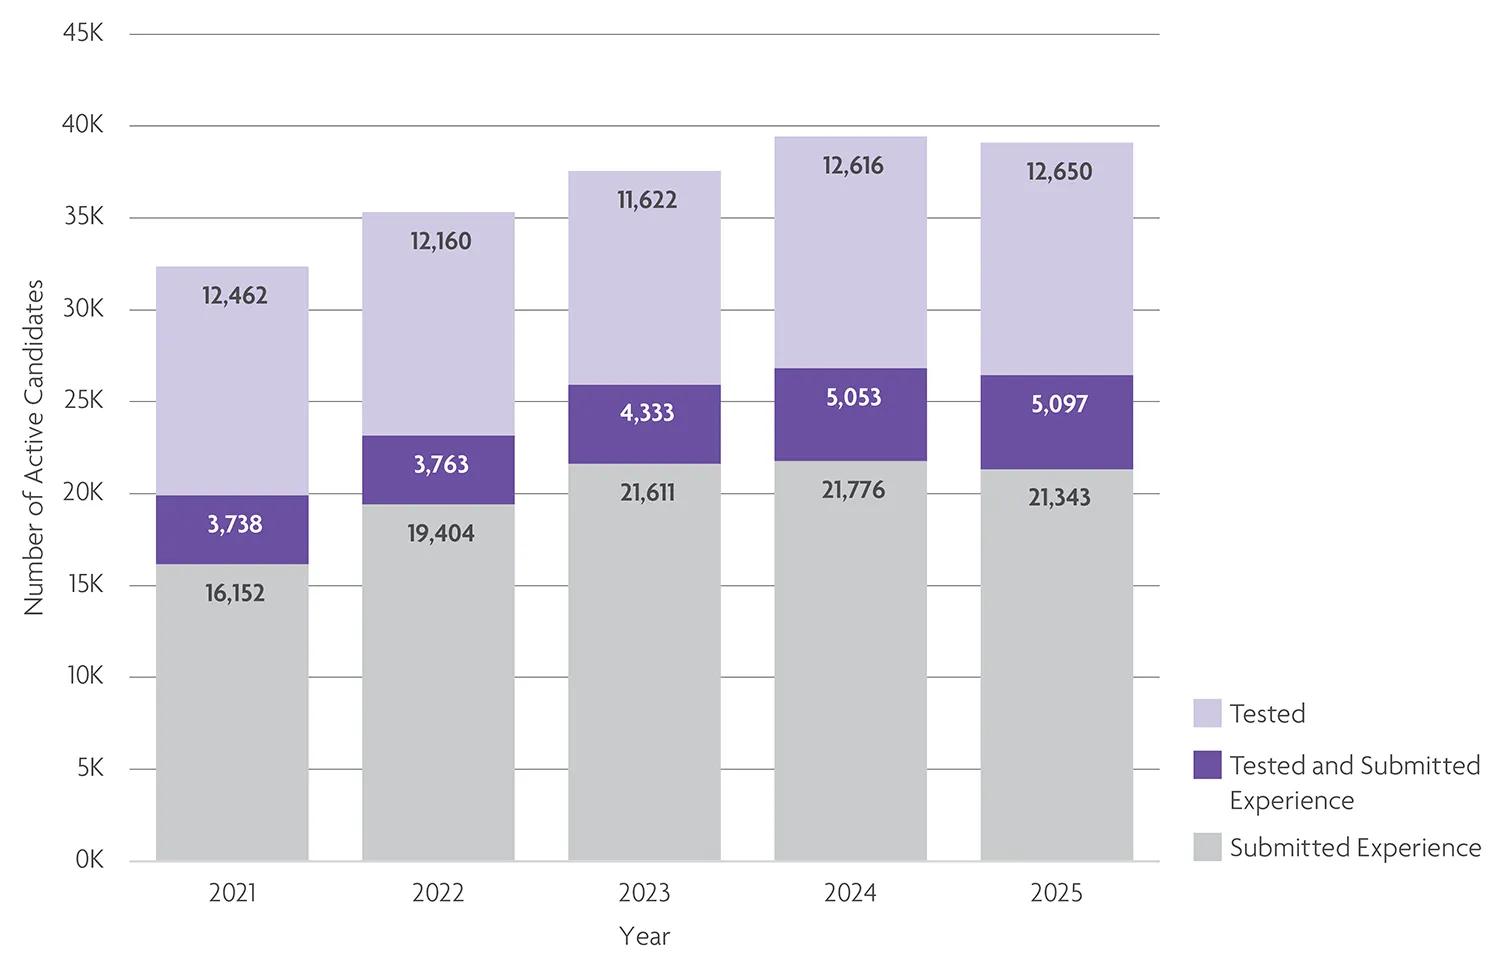
The number of candidates actively pursuing licensure fell by 1% (roughly 400 individuals) in 2025. Throughout the year, just over 39,000 candidates reported experience, took a division of the exam, or both. Despite this year’s slight decrease, NCARB has seen consistently high numbers of active licensure candidates in 2023 – 2025, a sign that the pipeline of new architects is healthy and growing.
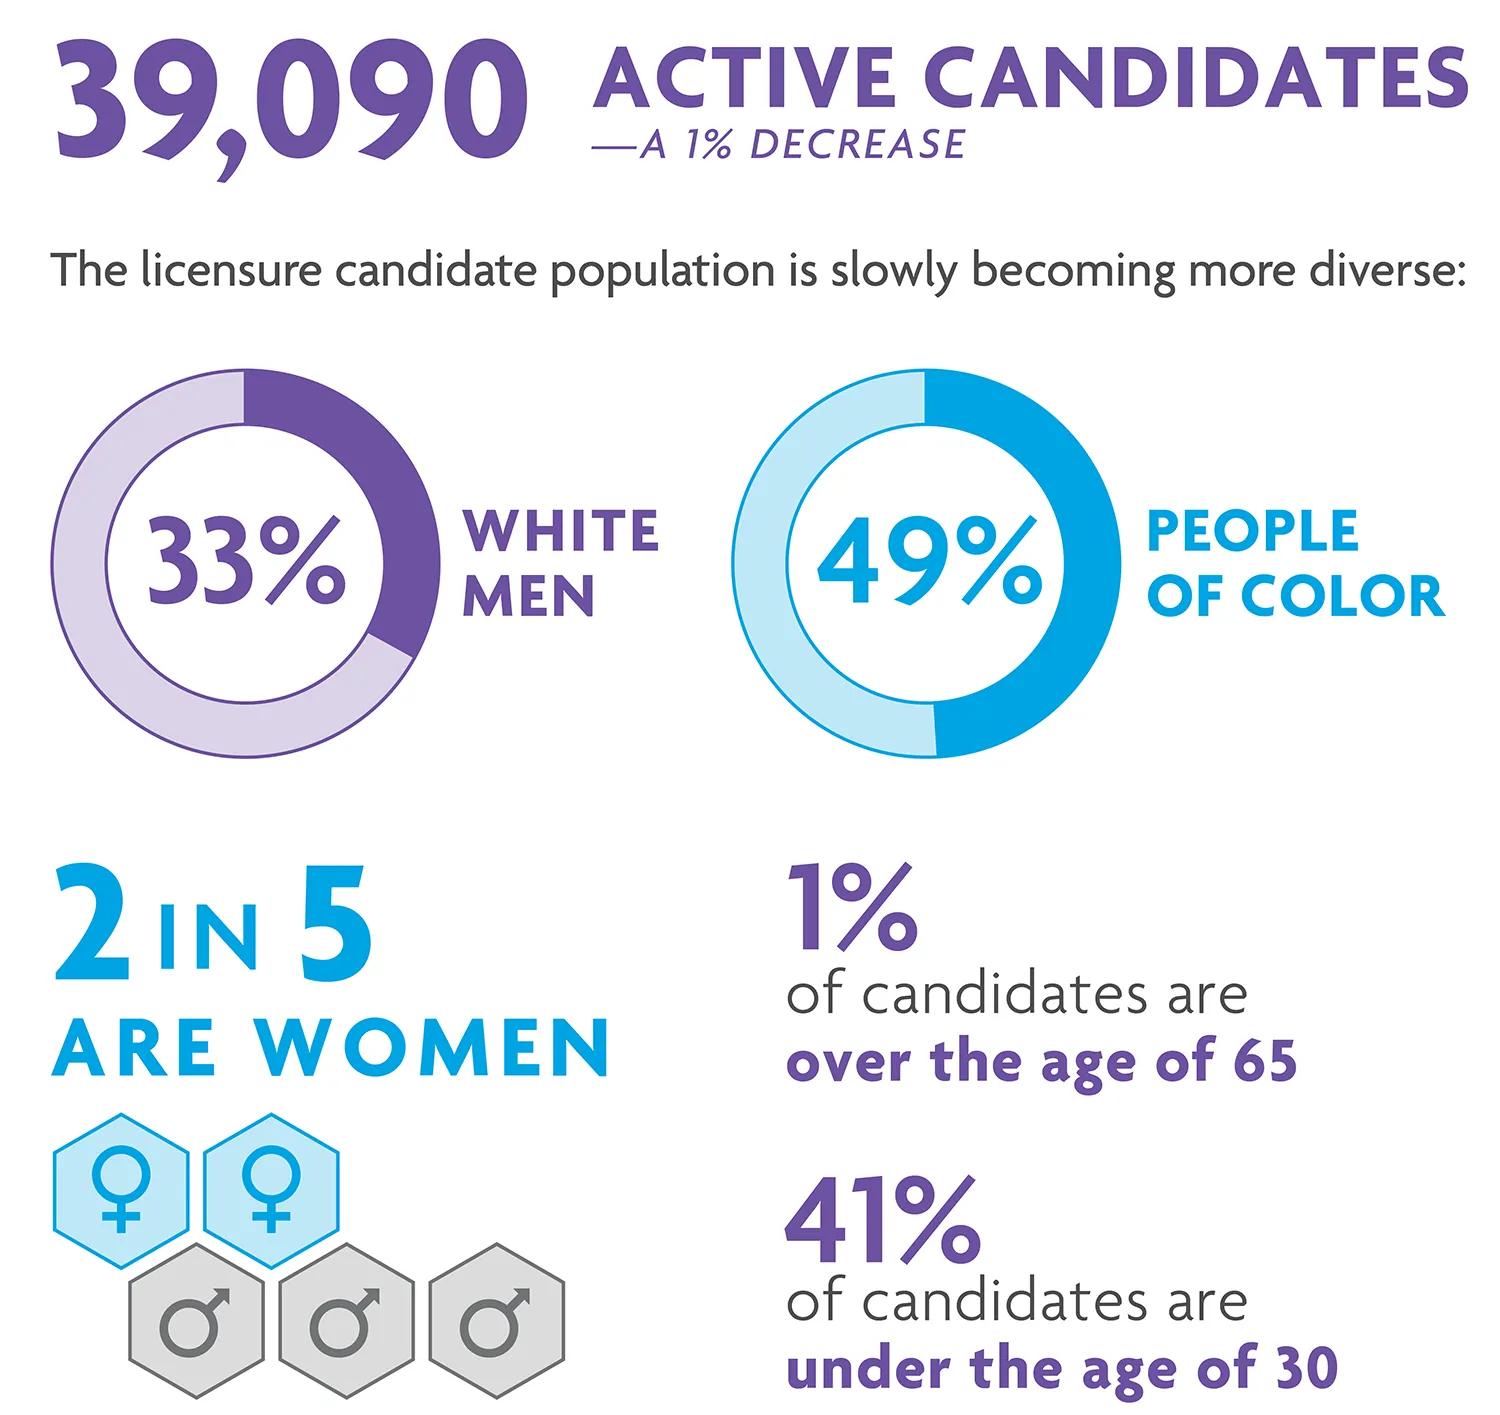
Since most active candidates eventually become licensed architects, the elevated numbers seen in the candidate pool in recent years suggests that the number of new architects may increase in the next decade. These individuals could offset any potential decline in the number of architects as baby boomers retire in the future.
The number of new architects fell by 6%.
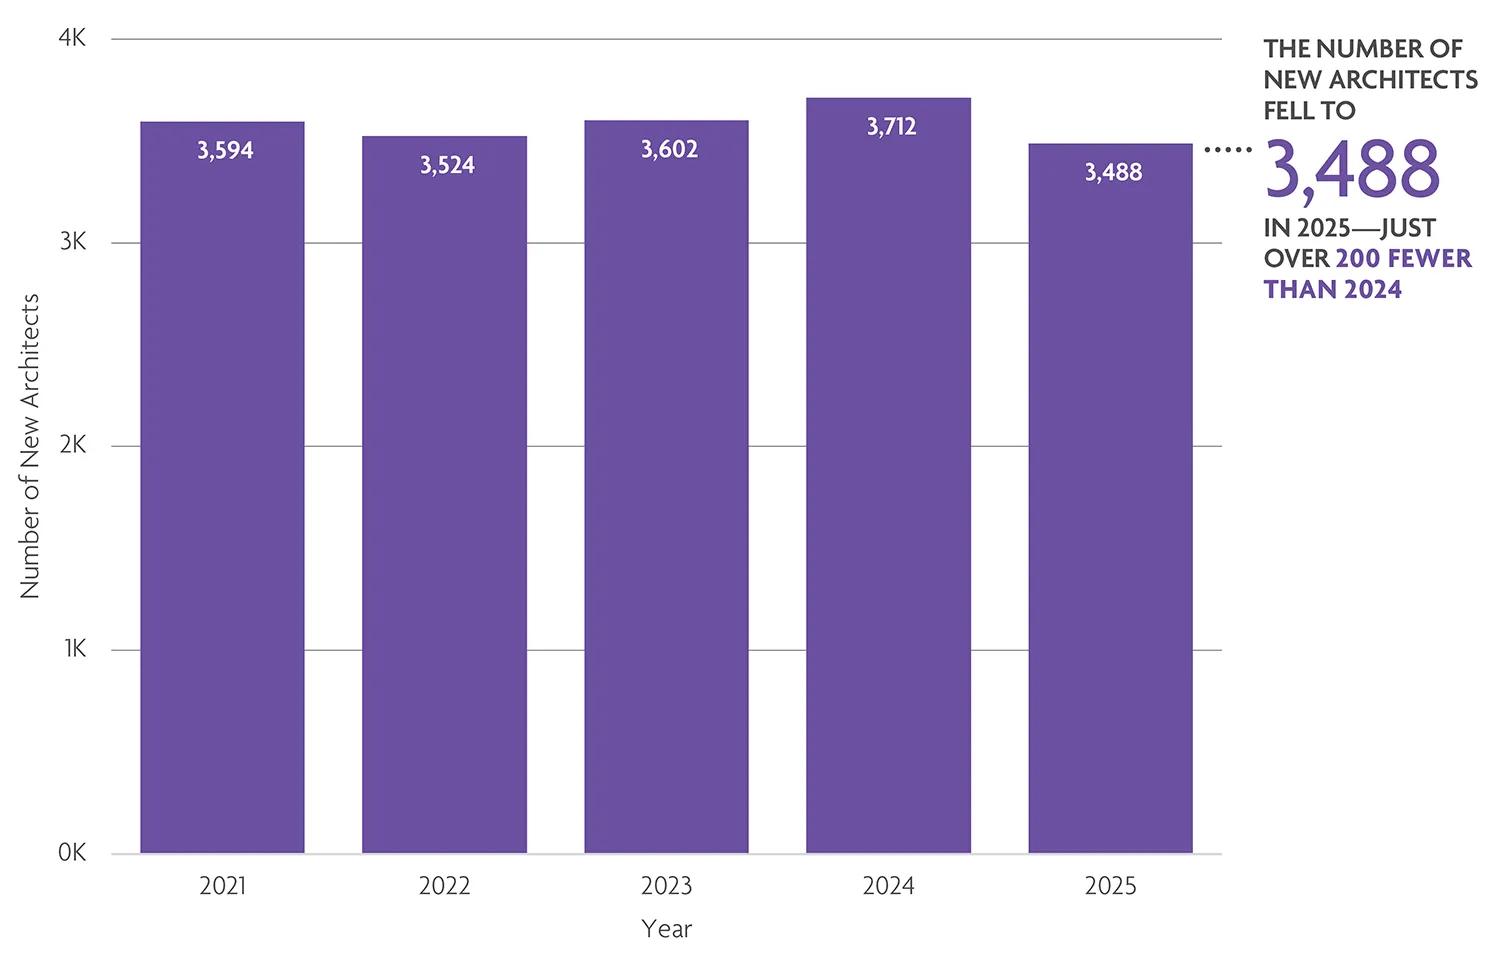
Nearly 3,500 licensure candidates finished the path to licensure and became architects in 2025, a 6% decrease compared to 2024. The 6% decrease (224 individuals) aligns with the slight decline seen in the overall candidate population in 2025. Typically, 9 – 10% of the total candidate pool completes the path to licensure each year, which remains true for 2025.
WHO’S CONSIDERED A “NEW ARCHITECT?” “New architects” refers to individuals who completed their final requirement for licensure in a given year. The last requirement for most candidates is the exam, which is why the number of new architects closely aligns with the number of exam completions.
Candidates got licensed 4 months faster in 2025.
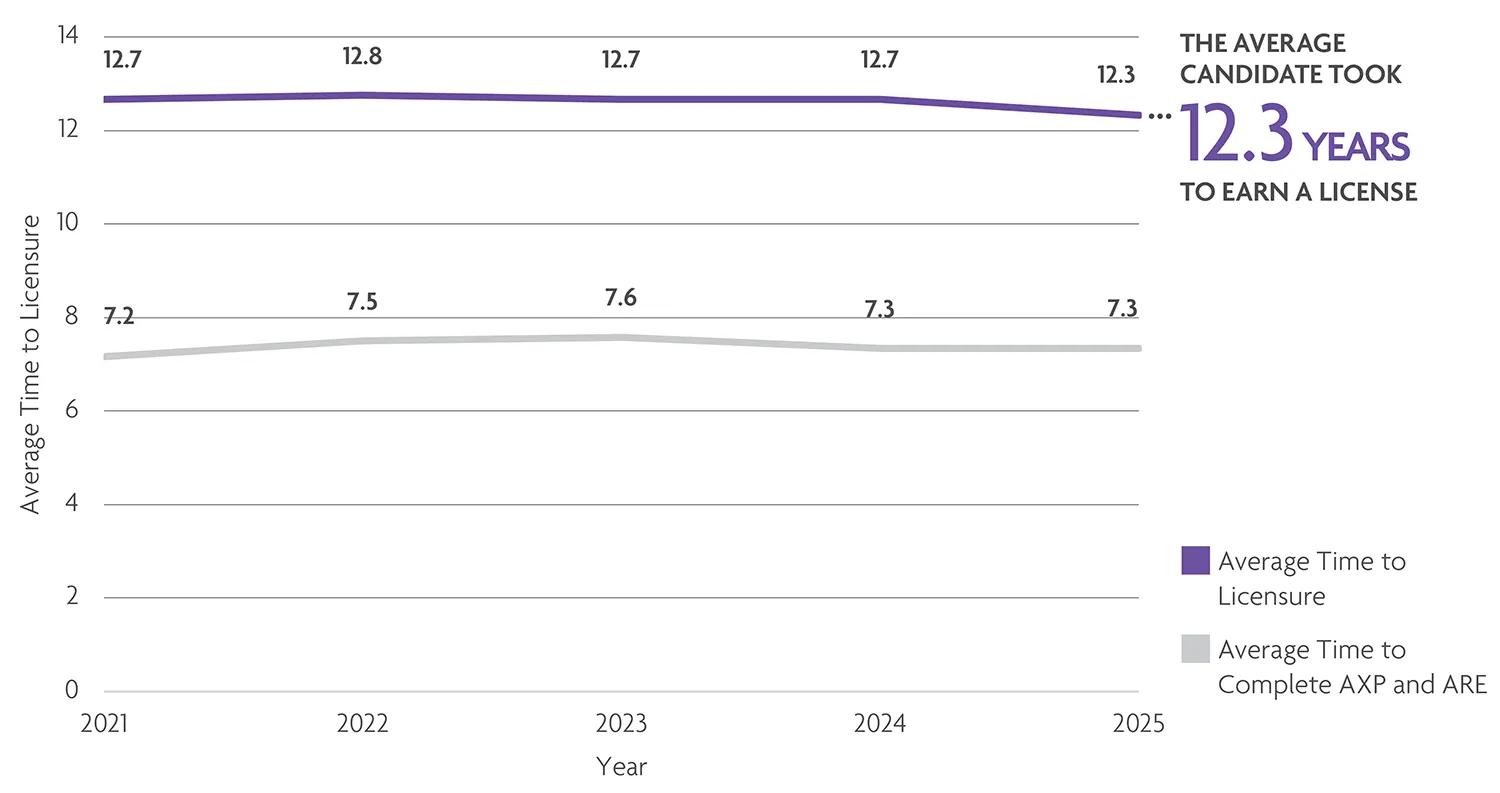
The average individual who earned a license in 2025 took 12.3 years to do so. The total time to complete the path to licensure—including earning a degree, completing the experience program, and passing the exam—fell by 3% or approximately 4 months. Candidates completed both the Architectural Experience Program® (AXP®) and Architect Registration Examination® (ARE®) faster in 2025, although the combined time to complete both programs held steady at 7.3 years. The drop in individual program completion time but stability in combined program completion time could be due to candidates taking a break between completing one program and starting another.
Over the past several years, NCARB has been working to implement programmatic changes designed to make licensure more accessible, such as retiring the exam’s 5-year rolling clock policy and adjusting the experience program’s reporting policy. While these changes have seen short-term decreases in time to complete NCARB’s programs, it’s possible that removing artificial time constraints on the path to licensure could increase the average time it takes to become an architect in the future. That’s why we’re shifting our focus from time to licensure to accessibility of licensure: NCARB believes it’s critical that all candidates can choose a pathway to practice that aligns with their goals, timeline, and experiences.
37% of this year’s cohort of candidates stopped pursuing a license.

The typical candidate takes between 12 – 13 years to complete the path to licensure; as a result, individuals licensed in 2025 likely started the path to licensure in 2012. To better understand potential impediments that might be preventing candidates from becoming architects, we track candidates’ activity on the licensure path over this 13-year period.
Of individuals who started an NCARB Record in 2012, 46% have since become licensed. An additional 17% were still actively working to become licensed in 2025, and 37% had fallen off the path to licensure.
This level of attrition is similar to what NCARB has seen in recent years; average attrition on the path to licensure typically ranges between 36 – 38% for any individual cohort. As with any other profession, it’s not unusual to see individuals change their career plans or profession over time—especially for those early in their careers.
Attrition by Race and Ethnicity
When viewed by race and ethnicity, there was a significant difference in attrition rates for white candidates compared to their non-white peers. Compared to candidates of color, white candidates who started an NCARB Record in 2012 were far more likely to be licensed in 2025: 54% of white candidates were licensed, compared to 32% of candidates of color. People of color who started an NCARB Record in 2012 were also more likely than their white peers to have stopped pursuing licensure: 44% of candidates of color fell off the path to licensure, compared to 33% of white candidates.
Attrition by Gender
When viewed by gender, the disparities between men and women were present but less significant than they were across racial and ethnic groups. Women who started an NCARB Record in 2012 were 4 percentage points more likely to have fallen off the path to licensure in 2025: 35% of men had stopped pursuing a license, compared to 39% of women. By contrast, men were more likely to have earned their license (48% of men compared to 44% of women).
WHERE ARE NONBINARY CANDIDATES? Currently, the number of licensure candidates who started an NCARB Record in 2012 and have identified as nonbinary does not meet NCARB’s standard sample size, which is 30.
Candidates are most likely to fall off the path to licensure after completing one core program.
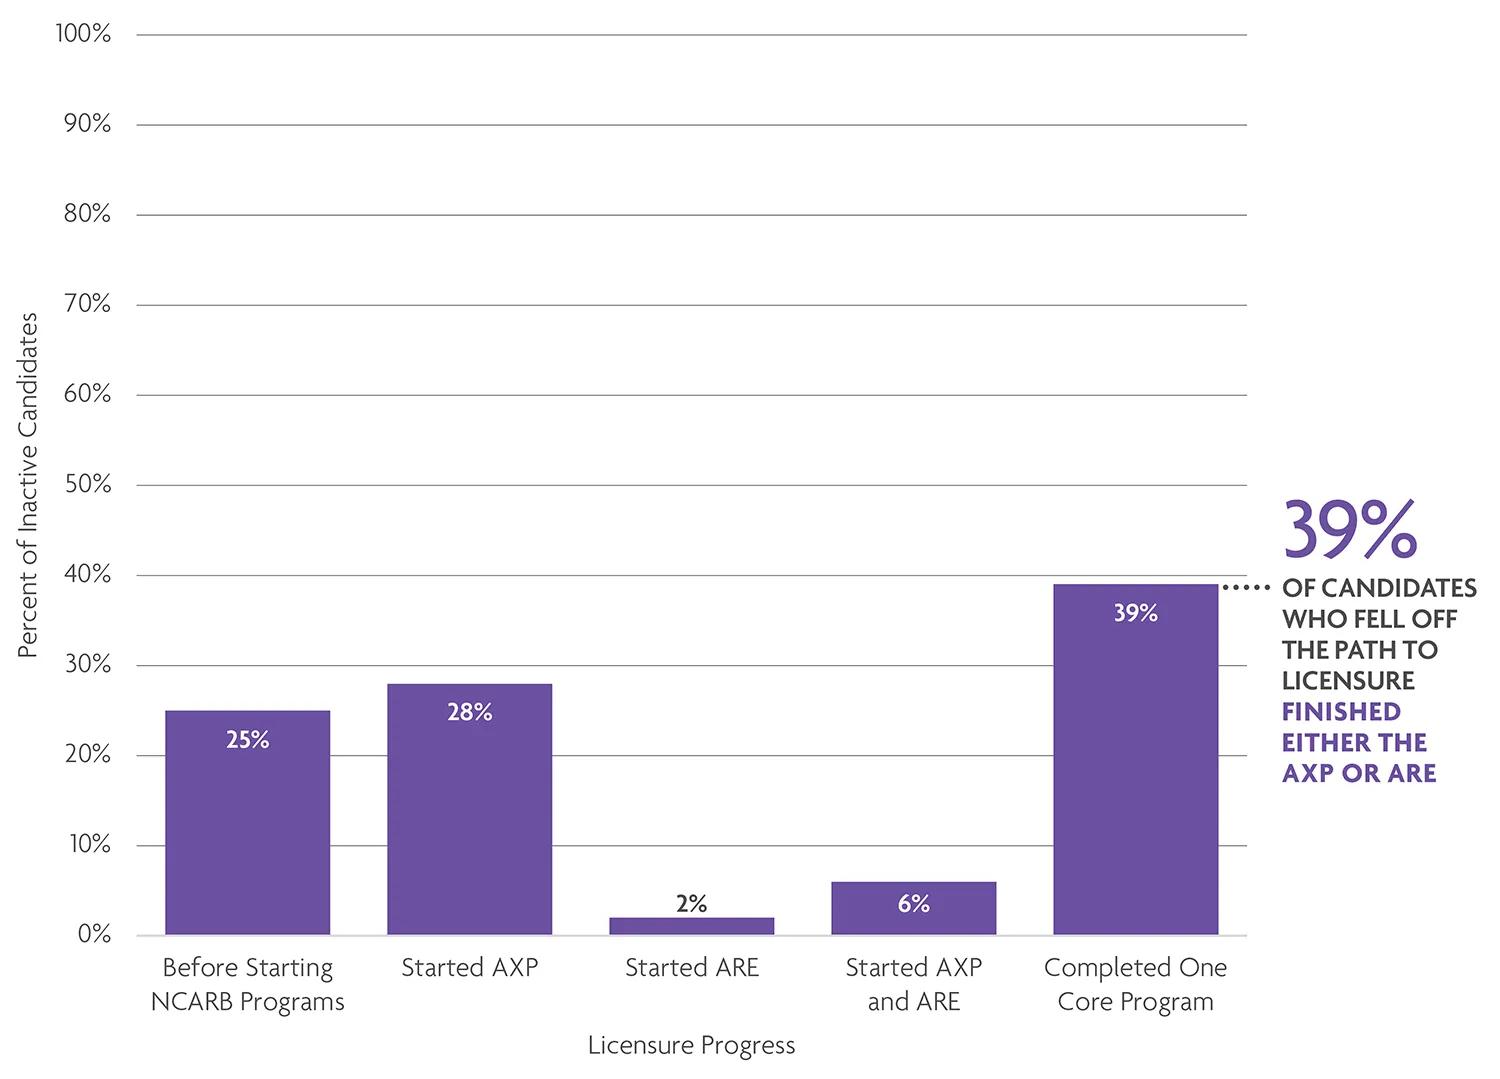
Of candidates who started their Record in 2012 and have since become inactive, 39% fell off the licensure path after completing either the AXP or ARE (typically the AXP). An additional 25% of licensure candidates fall off the path to licensure at some point after graduation but before starting the experience program or the exam. These individuals may still be working in the architecture industry but have decided not to pursue a license, or they may return to the licensure path in the years ahead.