Despite COVID-19’s impact on the licensure pipeline, the number of U.S. architects continued to rise in 2020, as did the number of reciprocal (out-of-state) licenses. There are now over 121,000 architects licensed across the 55 U.S. jurisdictions, a 5 percent increase compared to 2019.
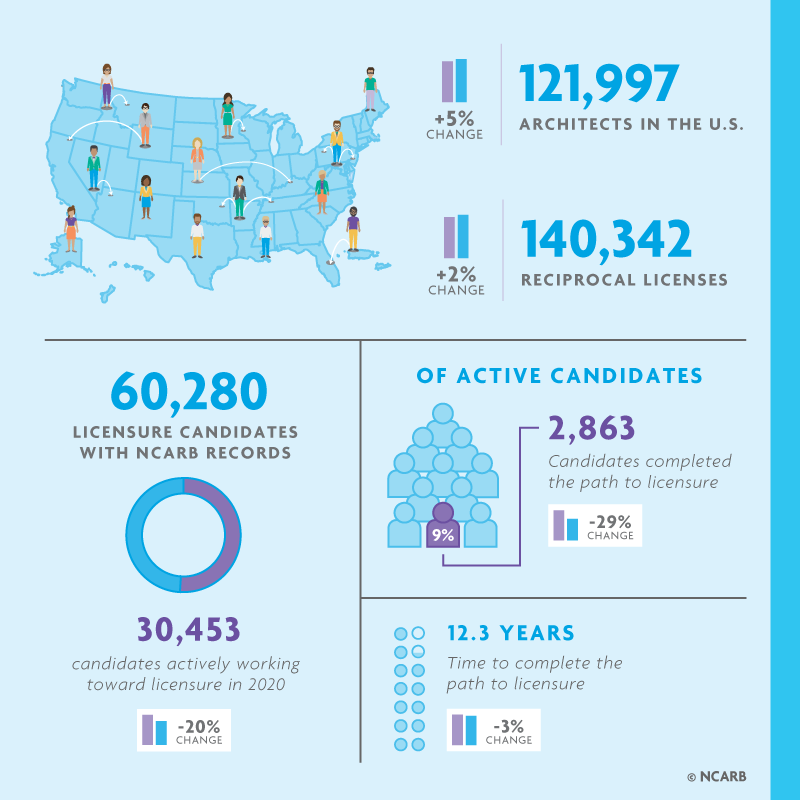 Less than 3,000 individuals completed the path to licensure in 2020, a 29 percent decline caused by the closure of test centers and drop in experience reporting. Candidates completing the licensure process represent 9 percent of the active candidate pool, just one percentage point fewer than the proportion seen in the previous year. However, candidates completed the path to licensure in 12.3 years, about five months sooner than in 2019.
The number of candidates testing or reporting experience fell by 20 percent in 2020, with just over 30,000 candidates making progress on the path to licensure. Early data from 2021 suggests these numbers are already on the path to recovery.
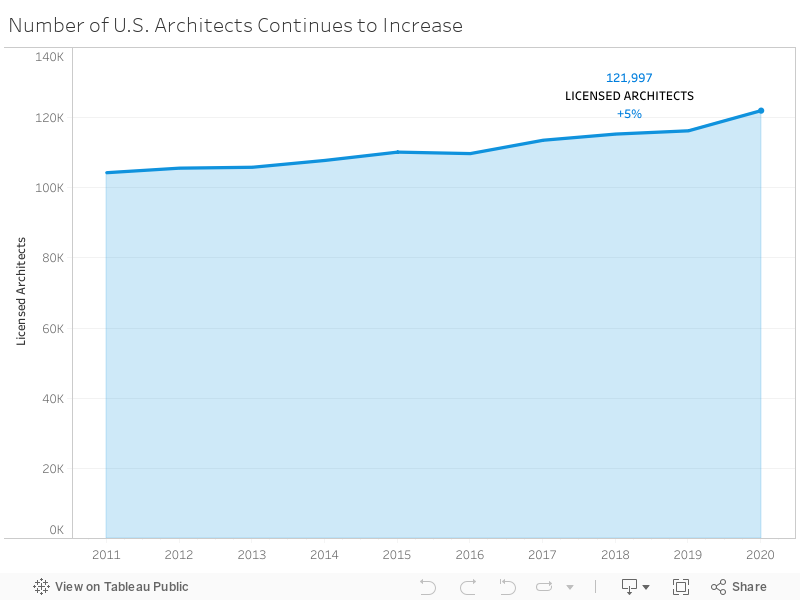
The number of architects licensed in the United States rose to 121,997 in 2020, according to the annual Survey of Architectural Registration Boards. This is a 5 percent increase from 2019 and represents a 17 percent increase compared to the number of U.S. architects seen a decade ago. This suggests that the pipeline of new architects continues to offset the number of retiring architects.
The 2020 uptick seems at odds with the impact of COVID-19, which saw fewer candidates complete the path to licensure in 2020. However, there is usually a slight lag between candidates’ completion of the licensure path and the impact of those completions on state licensure data. This, coupled with the commercial and social turbulence of the pandemic, suggests the number of licensed architects seen in the years ahead may not be as high as the number reported in 2020.
Generally, the steady growth seen in previous years supports a positive trend line, and assuages the profession’s concern that the number of practitioners would dwindle as baby boomers (who made up a large proportion of the architect population) began to step away from the profession. It appears many retiring architects choose to maintain their professional credentials, which could also impact this data.
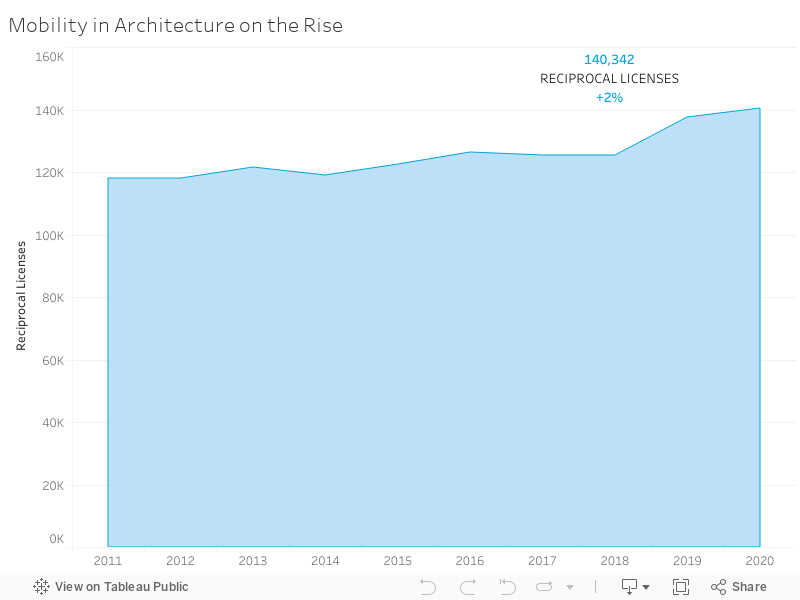
The 2020 Survey of Architectural Registration Boards also revealed that there continues to be more reciprocal (out-of-state) licenses than resident licenses issued in the United States. Regulators and legislators frequently use data related to reciprocal licenses as an indicator of mobility in licensed professions.
There were 140,342 reciprocal licenses reported in 2020, approximately 2 percent more than in 2019 and nearly 20,000 higher than the number of individual architects. This represents the largest number of reported reciprocal licenses on record. The total number of reciprocal licenses suggests that the average architect is licensed in at least two U.S. jurisdictions, and that the current path to mobility in the profession is effective.
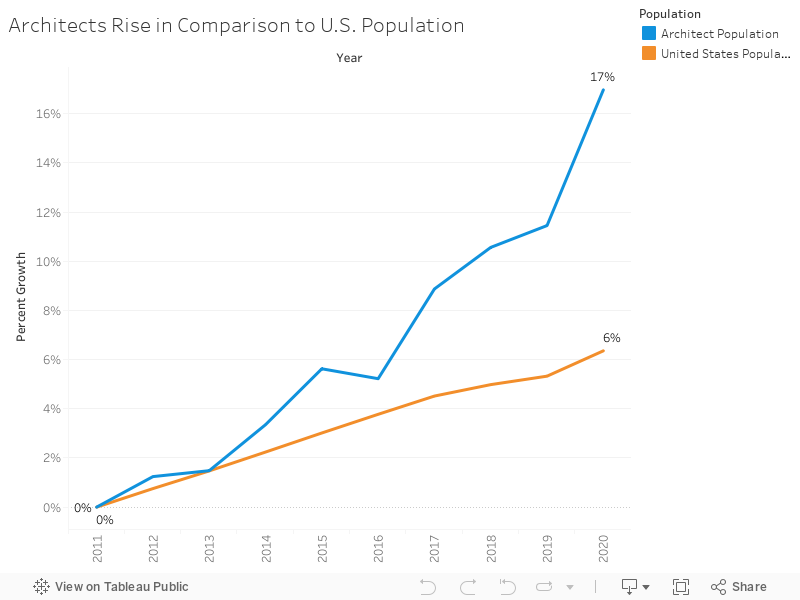
While the number of architects licensed in the United States has risen 17 percent in the last decade, the total U.S. population has risen just 6 percent, according to data from the U.S. Census Bureau.
There are now slightly more architects per capita (roughly 1 architect to every 2,700 people) than there were in 2011 (roughly 1 architect to every 2,900 people). Many architects maintain their professional licenses into retirement, which could also impact this data.
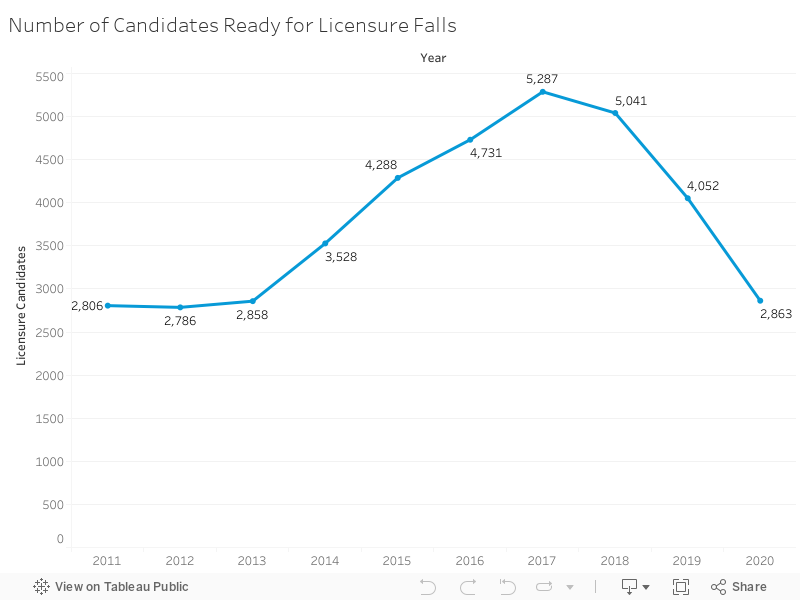
In 2020, just under 3,000 candidates finished the path to licensure, which includes the national experience and examination programs. Completing these key requirements for licensure is a reliable indicator that an individual has become (or will soon become) licensed in a U.S. jurisdiction.
The number of candidates completing their core requirement fell by 29 percent compared to 2019. The decrease over the last three years was expected following the peak in 2017, driven by experience and examination program changes. The 2020 figure appears to represent a return to historical normal; however, the COVID-19 pandemic had a negative impact on this datapoint, as candidates were unable to make exam progress for three months due to test center closures.
Note: The core requirements for licensure in the United States include gaining an education (typically a degree from a NAAB-accredited program), completing the AXP, and passing the ARE. Some jurisdictions have additional requirements, such as a supplemental exam.
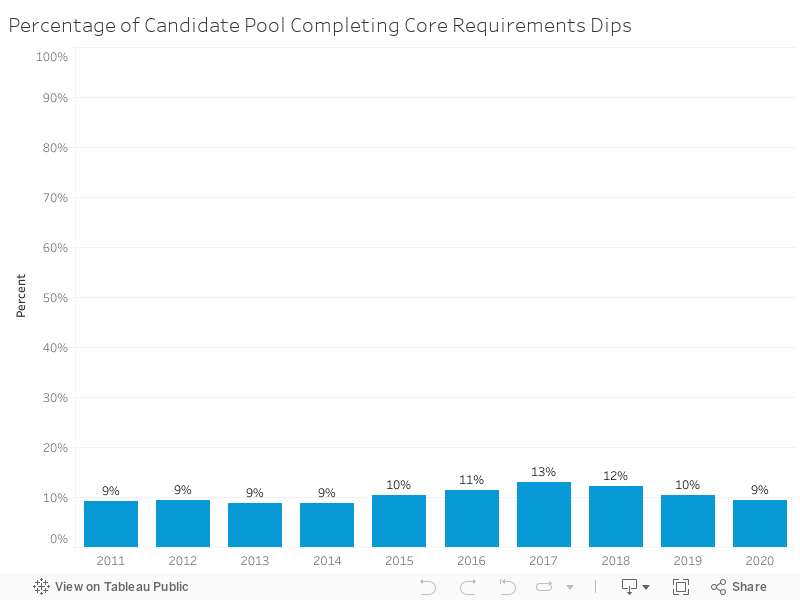
The 2,863 candidates who completed their final core requirement for licensure in 2020 represented approximately 9 percent of all individuals actively working toward earning a license. This is a 1 percentage point decrease compared to 2019 and is similar to the percentages seen from 2011-2014.
This chart indicates that while the number of candidates who completed the path to licensure in 2020 was significantly smaller than in recent years (see Number of Candidates Ready for Licensure Falls), the total candidate pool is also smaller. This is a result of the high number of candidates who completed the path—and therefore left the pool—in 2016-2019, as well as the increase in candidates leaving the licensure path (potentially temporarily) due to COVID-19’s impact on the profession.
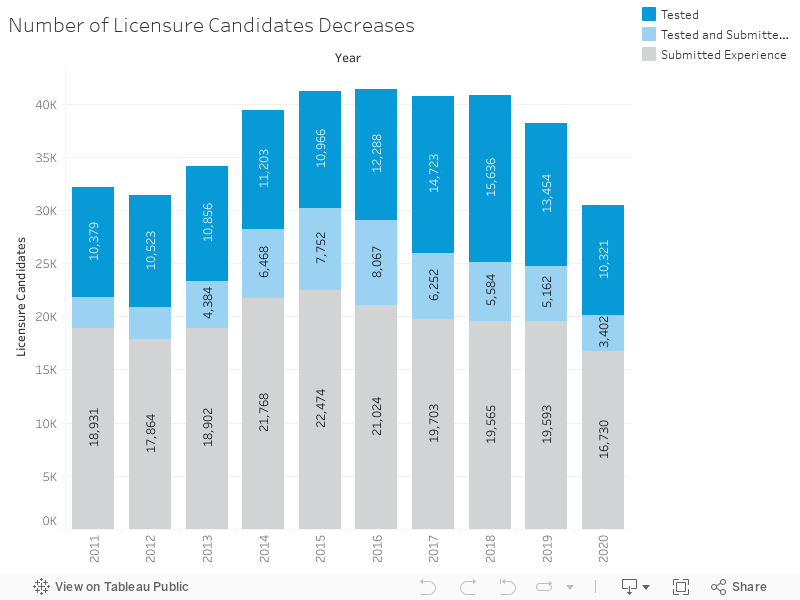
In 2020, just over 30,000 individuals actively worked toward licensure by reporting experience, taking the examination, or both. This is a 20 percent decrease in the number of candidates making AXP and/or ARE progress compared to 2019.
Of the pool of candidates making progress in 2020, just over 3,400 overlapped programs by taking at least one ARE division while reporting AXP experience. This marks the third year in a row the number of candidates overlapping programs has shrunk, and represents a 34 percent decrease in the number of candidates working to complete both programs at the same time. However, the majority of candidates still overlap these core requirements at some point during their licensure pathway (see Most Candidates Overlap the ARE and AXP).
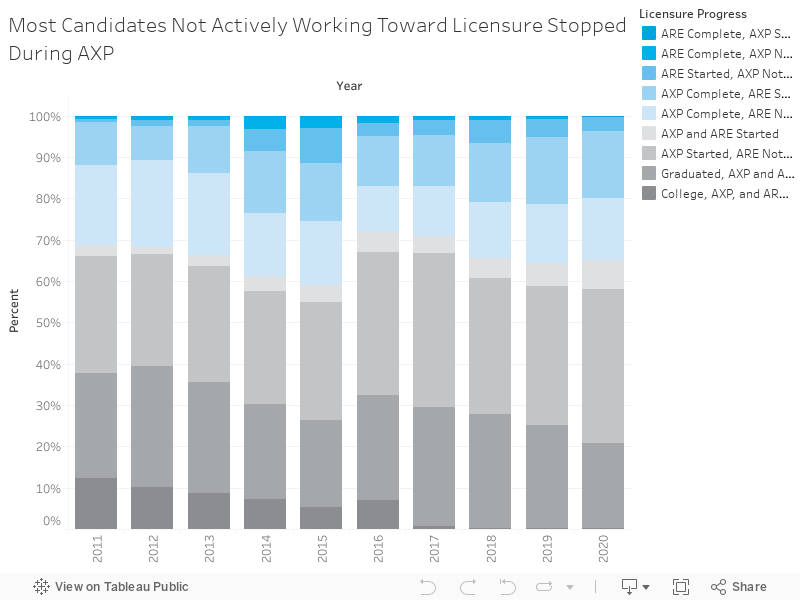
In 2020, over 30,000 candidates maintained an active NCARB Record, but didn’t report any experience or take a division of the ARE. While these candidates did not make progress toward licensure in 2020, their active NCARB Record indicates that they intend to return to the licensure path in the future.
Of candidates who maintained an active Record but didn’t work toward licensure, the largest group have reported experience but have yet to take an exam (37 percent). A significant number of candidates (21 percent) have established a Record, but have yet to report any experience or exam progress.
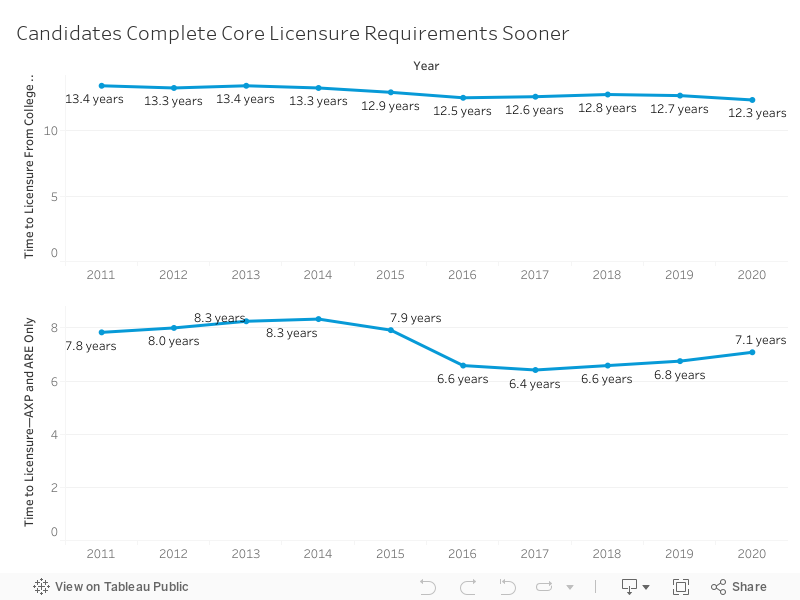
The average licensure candidate who completed their final core requirement for licensure in 2020—including education, experience, and examination—took 12.3 years. This is 3 percent less time (about five months) than candidates who completed their final core requirement in 2019.
On average, 7.1 of those years were spent completing NCARB’s experience and examination programs, an increase of 4 percent (about 4 months) compared to 2018. This uptick in time to complete NCARB programs reflects the impact of test center closures and general disruption caused by the COVID-19 pandemic.
Note: Historical data can shift because licensure candidates can backdate experience up to five years.